Unlock a world of possibilities! Login now and discover the exclusive benefits awaiting you.
- Qlik Community
- :
- Forums
- :
- Analytics & AI
- :
- Products & Topics
- :
- App Development
- :
- Monthly Cumulative Target based on Previous Year
- Subscribe to RSS Feed
- Mark Topic as New
- Mark Topic as Read
- Float this Topic for Current User
- Bookmark
- Subscribe
- Mute
- Printer Friendly Page
- Mark as New
- Bookmark
- Subscribe
- Mute
- Subscribe to RSS Feed
- Permalink
- Report Inappropriate Content
Monthly Cumulative Target based on Previous Year
I have a data set that has worker injury claims (harms) and the date of injury.
I would like to be able to generate a line on a combo chart that shows a monthly cumulative target based on the count of claims from the previous year.
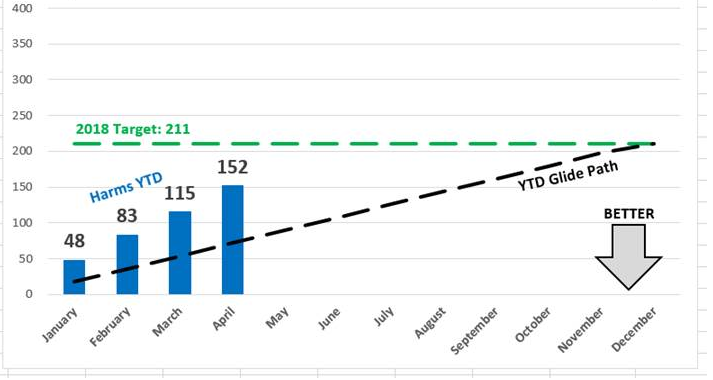
So if the previous year (2017) had 211 claims, and we wanted to finish equal to or under that total, then the line would be based on 211/12=17.58 claims per month in 2018.
I want to show the cumulative total in 2018 with bars (blue bars below), and the monthly target based on the previous year monthly average with a line (black dotted line below). I have the blue bars figured out. I just can't figure how to calculate the dotted black line.
2018 monthly targets ("glide path") would be:
Jan-2018 target = 17.58
Feb-2018 target = 35.16
March-2018 target = 52.74
etc..
The screenshot is provided to give a general sense of what I need.
- Mark as New
- Bookmark
- Subscribe
- Mute
- Subscribe to RSS Feed
- Permalink
- Report Inappropriate Content
Hi Jason,
You can use Linest_m +linest_B function to calculate the slope and it will work for you.
Y = mx + b
Regards,
Akshaya