Unlock a world of possibilities! Login now and discover the exclusive benefits awaiting you.
- Qlik Community
- :
- Forums
- :
- Analytics & AI
- :
- Products & Topics
- :
- App Development
- :
- Percentage Calculation in Cohort Analysis
- Subscribe to RSS Feed
- Mark Topic as New
- Mark Topic as Read
- Float this Topic for Current User
- Bookmark
- Subscribe
- Mute
- Printer Friendly Page
- Mark as New
- Bookmark
- Subscribe
- Mute
- Subscribe to RSS Feed
- Permalink
- Report Inappropriate Content
Percentage Calculation in Cohort Analysis
Hello,
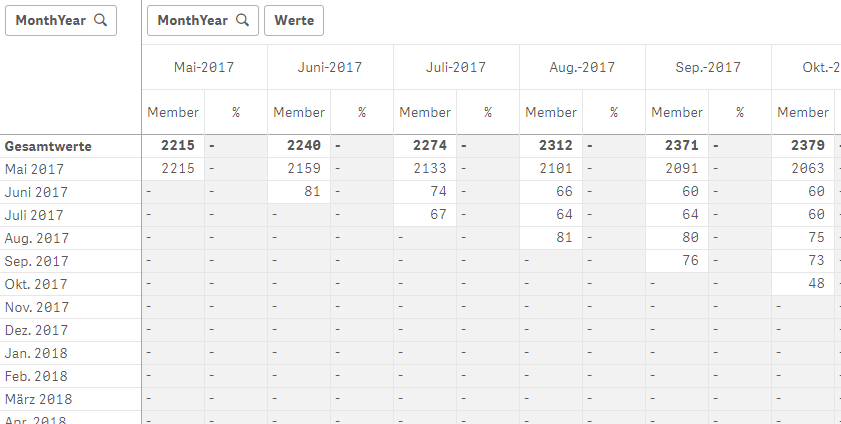
I built a Cohort Analysis Table like the image below. But I cant figure out, how I am able to calculate the percentage values of each column and row in Comparison to the first value in the row.
E.G.: In the 'Juni-2017' column I want the Percentage difference between 2215 and 2159 which is roughly 97%. In the row below I want 100% because 81 is 100% of itself.
Thanks in Advance
Accepted Solutions
- Mark as New
- Bookmark
- Subscribe
- Mute
- Subscribe to RSS Feed
- Permalink
- Report Inappropriate Content
I got it to work with :
left([Member], 1000) / count(distinct total <YEARMONTH>{<isMember={1}>}DEALER_ID)
YEARMONTH is the upper Dimension. The 1000 is just way overgrowth to make sure, it takes all digits in the field.
Sadly the same doesnt work for my second Pivot, although its exactly the same just with Fees instead of Members. E:G.:
Fee is: Sum({isMember={1}}DBD_LISTING_FEES)
and % therefore should be: left([Listing Fee], 1000) / Sum(total <YEARMONTH>{isMember={1}}DBD_LISTING_FEES)
But this doesnt work, dont know why though.
- Mark as New
- Bookmark
- Subscribe
- Mute
- Subscribe to RSS Feed
- Permalink
- Report Inappropriate Content
What is your expression for Member here?
- Mark as New
- Bookmark
- Subscribe
- Mute
- Subscribe to RSS Feed
- Permalink
- Report Inappropriate Content
Count({<isMember = {1}>}DEALER_ID)
- Mark as New
- Bookmark
- Subscribe
- Mute
- Subscribe to RSS Feed
- Permalink
- Report Inappropriate Content
May be this
Alt(
  Count({<isMember = {1}>}DEALER_ID)/Before(Count({<isMember = {1}>}DEALER_ID))
, 1)- Mark as New
- Bookmark
- Subscribe
- Mute
- Subscribe to RSS Feed
- Permalink
- Report Inappropriate Content
alt ( ...
Before(Count({<isMember = {1}>}DEALER_ID)))
just returns the value, one column before and not the first in the row.
- Mark as New
- Bookmark
- Subscribe
- Mute
- Subscribe to RSS Feed
- Permalink
- Report Inappropriate Content
I got it to work with :
left([Member], 1000) / count(distinct total <YEARMONTH>{<isMember={1}>}DEALER_ID)
YEARMONTH is the upper Dimension. The 1000 is just way overgrowth to make sure, it takes all digits in the field.
Sadly the same doesnt work for my second Pivot, although its exactly the same just with Fees instead of Members. E:G.:
Fee is: Sum({isMember={1}}DBD_LISTING_FEES)
and % therefore should be: left([Listing Fee], 1000) / Sum(total <YEARMONTH>{isMember={1}}DBD_LISTING_FEES)
But this doesnt work, dont know why though.