Unlock a world of possibilities! Login now and discover the exclusive benefits awaiting you.
- Qlik Community
- :
- Forums
- :
- Analytics & AI
- :
- Products & Topics
- :
- App Development
- :
- Percentages in bar chart
- Subscribe to RSS Feed
- Mark Topic as New
- Mark Topic as Read
- Float this Topic for Current User
- Bookmark
- Subscribe
- Mute
- Printer Friendly Page
- Mark as New
- Bookmark
- Subscribe
- Mute
- Subscribe to RSS Feed
- Permalink
- Report Inappropriate Content
Percentages in bar chart
Hi,
I know this topic has been covered before, but I am unable to get my answers from any of the other forums.
But could anybody please explain to me in detail on how to change bar charts to show percentages?
I am still pretty new to Qlik Sense, so still getting to know how to work all the different coding syntaxes.
I have charts that have a numeral count as a measure, mixed with either 1 or 2 dimensions of which both are non numeral values.
It would be greatly appreciated if someone would be able to explain to me how I turn this chart into a 100% stacked barchart.
I have also tried downloading the anychart extension, however this extension only allows me to use multiple measures to stack the chart, not multiple dimensions.
Thanks.
- Mark as New
- Bookmark
- Subscribe
- Mute
- Subscribe to RSS Feed
- Permalink
- Report Inappropriate Content
Can you give us some sample data to work with ?
- Mark as New
- Bookmark
- Subscribe
- Mute
- Subscribe to RSS Feed
- Permalink
- Report Inappropriate Content
Hi,
Unfortunately I work with confidential data. I have looked if if can send some sort of data graph, but none of the data that I work with is available for public sharing.
To break it down in text:
Dimension 1: Performance scores (1,2,3,4,5)
Dimension 2: Movement type (No move, lateral move, promotion etc..)
Measure 1: ID based on the count hereof.
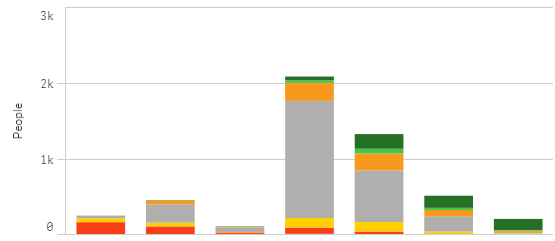
This is presented in the stacked barchart as seen in the picture of my first post.
Each bar represents a performance score, either 1, 2, 3, 4 and 5.
The colors in the bar represent the movement type.
And the ID is measured to represent to population.
I would like to see if possible percentages per color in each bar, or in case this is impossible, just see the bar reach a 100% with each movement type being measured relatively to the 100%
Thank you for taking the time with helping finding a solution!