Unlock a world of possibilities! Login now and discover the exclusive benefits awaiting you.
- Qlik Community
- :
- Forums
- :
- Analytics
- :
- Topics
- :
- App Development
- :
- Qlik Sense stacked bar chart max limit on Y axis n...
Options
- Subscribe to RSS Feed
- Mark Topic as New
- Mark Topic as Read
- Float this Topic for Current User
- Bookmark
- Subscribe
- Mute
- Printer Friendly Page
Turn on suggestions
Auto-suggest helps you quickly narrow down your search results by suggesting possible matches as you type.
Showing results for
Creator II
2017-04-18
12:37 PM
- Mark as New
- Bookmark
- Subscribe
- Mute
- Subscribe to RSS Feed
- Permalink
- Report Inappropriate Content
Qlik Sense stacked bar chart max limit on Y axis not working properly
Hello,
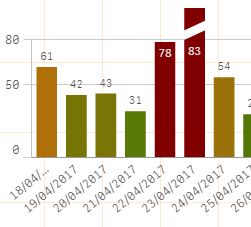
I've a chart with one dimension and one measure, with a max limit on Y axis set to 80 and I've this RIGHT situation:

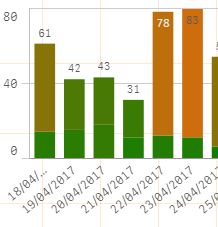
Now, if I add one dimension and set the chart type to stacked bar I've this WRONG situation:

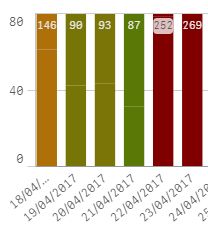
Same situation when I add one measure (so, one dimension and two measures):

Anybody has a workaround for this bug ?
Moreover, does anyone knows a trick to paint bar segments with different color when using one dimension and two measures.
Thanks in advance.
Paolo.
520 Views
1 Reply
Creator II
2017-06-30
08:37 AM
Author
- Mark as New
- Bookmark
- Subscribe
- Mute
- Subscribe to RSS Feed
- Permalink
- Report Inappropriate Content
Still having this situation with QS June 2017. Does anybody have answers ?
Thanks in advance.
442 Views