Unlock a world of possibilities! Login now and discover the exclusive benefits awaiting you.
- Qlik Community
- :
- Forums
- :
- Analytics
- :
- App Development
- :
- Qliksense Tooltip - Show the previous month Sales ...
- Subscribe to RSS Feed
- Mark Topic as New
- Mark Topic as Read
- Float this Topic for Current User
- Bookmark
- Subscribe
- Mute
- Printer Friendly Page
- Mark as New
- Bookmark
- Subscribe
- Mute
- Subscribe to RSS Feed
- Permalink
- Report Inappropriate Content
Qliksense Tooltip - Show the previous month Sales in the tooltip of a stacked bar chart
Dear Experts,
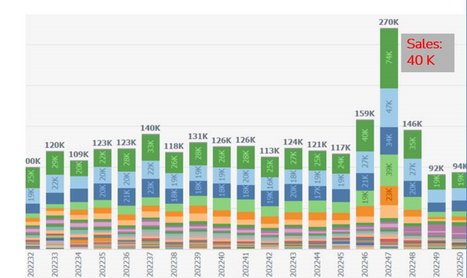
I have a requirement to show the Previous Month Sales in the tooltip of a stacked bar chart.
It contains two dimensions
Dimension 1. Month
Dimension 2. Product Category (about 100 Categories).
Problem : I have used the above function to obtain the previous month value, Unfortunately it did not work as expected.
Expression used : Above (Sum(sales))
Please see the screenshot below , for the week 202247 , For the first category it should show as 40 K as previous week sales.
Kindly help here.
- Mark as New
- Bookmark
- Subscribe
- Mute
- Subscribe to RSS Feed
- Permalink
- Report Inappropriate Content
Make it a table and try why it's not working.
- Mark as New
- Bookmark
- Subscribe
- Mute
- Subscribe to RSS Feed
- Permalink
- Report Inappropriate Content
Hi @Mario_ES ,
Thanks for the reply.
I have tried the option , it works properly in a table because we can modify the sorting order of the dimensions.
But In a bar chart, We do not have the option to modify the sorting order of the dimensions.
