Unlock a world of possibilities! Login now and discover the exclusive benefits awaiting you.
- Qlik Community
- :
- Forums
- :
- Analytics
- :
- App Development
- :
- Re: SPC Chart in Qlik Sense? I can't create it bec...
- Subscribe to RSS Feed
- Mark Topic as New
- Mark Topic as Read
- Float this Topic for Current User
- Bookmark
- Subscribe
- Mute
- Printer Friendly Page
- Mark as New
- Bookmark
- Subscribe
- Mute
- Subscribe to RSS Feed
- Permalink
- Report Inappropriate Content
SPC Chart in Qlik Sense? I can't create it because I can't add anymore measures
Hi QC,
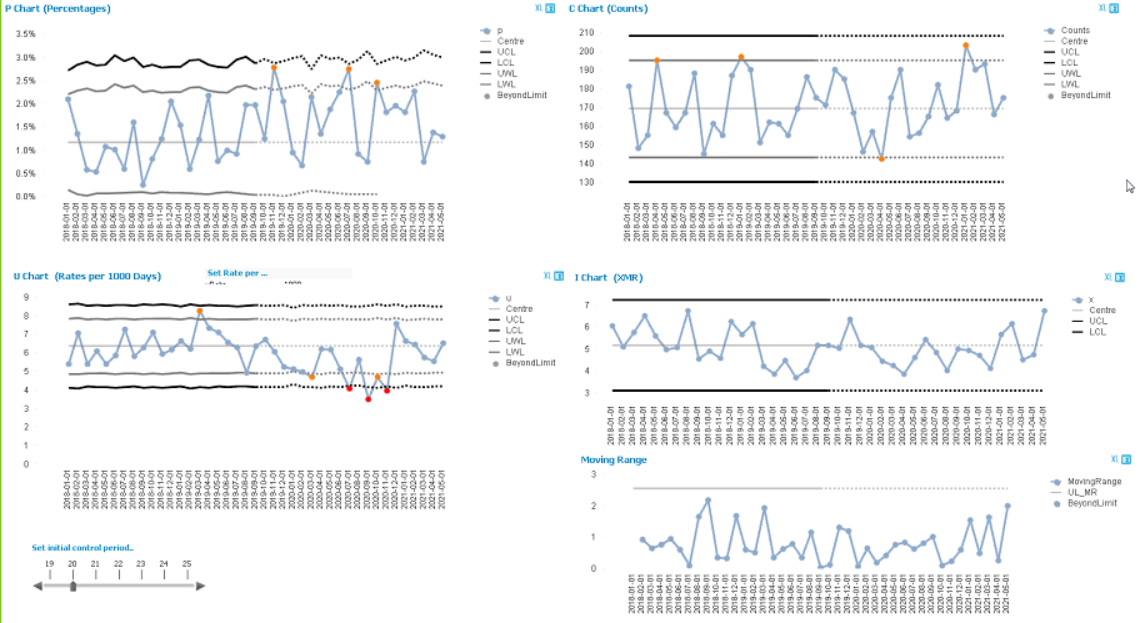
I'm trying to create an SPC chart in Qlik Sense. I liked the work by Erica Whally in QlikView that used counters to dynamically calculate Nelson's rule set.
I've managed to get something working by using a secondary axis to hide the counters. My issue now is that I can't add anymore than 15 measures to the chart to calculate the rules. I'm using Qlik Sense 3.2 SR2 and a combo chart.
Has anyone created an SPC chart in Qlik Sense with the rules for special cause variation? Does anyone know how to add more measures to a Combo chart?
I've attached the .qvf file I've been working on in case anyone has any ideas on this. I've set it up to you can add your own data to an excel template and drag and drop it into Sense. You need to select 1 measure and 1 dimension for the charts to calculate.
I would appreciate any help in getting something working
thanks
Jonathan
- Mark as New
- Bookmark
- Subscribe
- Mute
- Subscribe to RSS Feed
- Permalink
- Report Inappropriate Content
Hi jonopitchford - we have an on-demand session with National Health Services (NHS) and how they build and leverage Statistical Process Control Charts (SPC) and Run Charts in QlikView and Qlik Sense. johnmackintosh covers these topics in depth:
- Variation and importance in Quality Improvement (QI) projects within healthcare
- The Run Chart
- Run Chart Rules
- Simple QlikView run chart
- (Statistical) Process Control (SPC)
- ‘I’ ‘P’ ‘C’ ‘U’ - Examples
- Rare events / time between
Be sure to check this out: http://bit.ly/2Cc1GlK
- Mark as New
- Bookmark
- Subscribe
- Mute
- Subscribe to RSS Feed
- Permalink
- Report Inappropriate Content
Hi Jonathan,
Which extension object did you use to enter the value for Step Change, rule2, rule3 input Field Object?
As we copy your .qvf file and opened all the objects Step Change, Rule2, Rule3 Input Field object are showing as
"invalid visualisation" as shown below.
Thanks,
Naresh
