Unlock a world of possibilities! Login now and discover the exclusive benefits awaiting you.
- Qlik Community
- :
- Forums
- :
- Analytics
- :
- App Development
- :
- Set Analysis - How to Compare 2 Sets of Counts and...
- Subscribe to RSS Feed
- Mark Topic as New
- Mark Topic as Read
- Float this Topic for Current User
- Bookmark
- Subscribe
- Mute
- Printer Friendly Page
- Mark as New
- Bookmark
- Subscribe
- Mute
- Subscribe to RSS Feed
- Permalink
- Report Inappropriate Content
Set Analysis - How to Compare 2 Sets of Counts and Choose Minimum, Including 0
Hello - it seems like this should be easy, and the expression I have currently written is close (or at least it seems like it is), but it's not quite there. I've attached a QVF with an Inline data set, if that helps.
Current expression for "Minimum Employee Count" on the top chart:
SUM(AGGR(
MIN(AGGR(COUNT(DISTINCT EmployeeID),CompanyID,DepartmentID,JobCode))
,JobCode,DepartmentID))
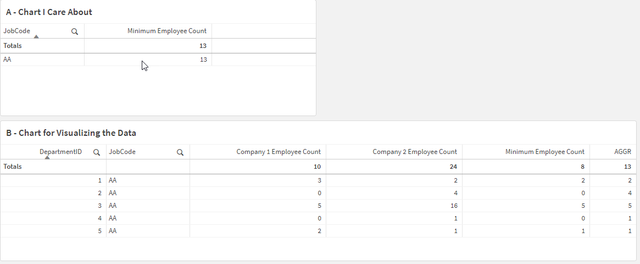
Current result = 13, Expected result = 8
Essentially, I need my expression to do a count of JobCode per CompanyID and DepartmentID, and then return the lower of the two numbers and do a final summation. If both counts are greater than 0, this expression works. However, if one count is greater than 0, and the other is 0, it chooses the number greater than 0 (I get why this is happening - the MIN is not choosing 0 because 0 is not in the result set, only the number greater than 0 is in the result set and is therefore the only option for MIN to choose).
So in the top chart below, the "Minimum Employee Count" = 13, however, I want this to be 8. If you look at the "Minimum Employee Count" metric from the bottom chart, that is giving the correct output per DepartmentID, and adds up to 8.
When my current expression compares DepartmentID = 1 for Company 1 and Company 2, it chooses the count of 2 from Company 2 (correct, 2 is less than 3). However, for DepartmentID = 2 it chooses the count of 4 from Company 2 instead of the count of 0 from Company 1 (incorrect).
If we include the DepartmentID as a dimension in the table, it is easy to do (as it is done in the bottom chart measure "Minimum Employee Count" which uses RANGEMIN). However, our requirement is to just do the count at the JobCode level.
Any help is appreciated, thank you!
- Tags:
- aggr
- set analysis
Accepted Solutions
- Mark as New
- Bookmark
- Subscribe
- Mute
- Subscribe to RSS Feed
- Permalink
- Report Inappropriate Content
@Hi, @agladfelter_optum
Try the expression below:
Sum(Agr(if(Company1<Company2,Company1,Company2),JobCode,DepartmentID))
Regarts,
Matheus
- Mark as New
- Bookmark
- Subscribe
- Mute
- Subscribe to RSS Feed
- Permalink
- Report Inappropriate Content
@Hi, @agladfelter_optum
Try the expression below:
Sum(Agr(if(Company1<Company2,Company1,Company2),JobCode,DepartmentID))
Regarts,
Matheus
- Mark as New
- Bookmark
- Subscribe
- Mute
- Subscribe to RSS Feed
- Permalink
- Report Inappropriate Content
@MatheusC, thanks for the response. And I agree this solution would work in Chart B (from my initial post), however, I need an expression that will work in Chart A, which only has JobCode as a dimension.
- Mark as New
- Bookmark
- Subscribe
- Mute
- Subscribe to RSS Feed
- Permalink
- Report Inappropriate Content
I don't see a problem with the expression I provided for this case. Let me know if there are any other details
Regarts,
Matheus
- Mark as New
- Bookmark
- Subscribe
- Mute
- Subscribe to RSS Feed
- Permalink
- Report Inappropriate Content
Can you post the exact expression used in Chart A?
- Mark as New
- Bookmark
- Subscribe
- Mute
- Subscribe to RSS Feed
- Permalink
- Report Inappropriate Content
adjust according to your fields
- Mark as New
- Bookmark
- Subscribe
- Mute
- Subscribe to RSS Feed
- Permalink
- Report Inappropriate Content
@agladfelter_optum
Managed to solve?
Mark the solution that solved the topic and press the like button if you found it useful!
Thanks,
Matheus
- Mark as New
- Bookmark
- Subscribe
- Mute
- Subscribe to RSS Feed
- Permalink
- Report Inappropriate Content
@MatheusC , I was able to get this to work by the following:
Create 2 new master measures:
Company1 Employee Count: COUNT({<CompanyID={1}>} DISTINCT EmployeeID)
Company2 Employee Count: COUNT({<CompanyID={2}>} DISTINCT EmployeeID)
And then I used your expression and plugged in the master measures:
SUM(AGGR(IF([Company1 Employee Count]<[Company2 Employee Count],[Company1 Employee Count],[Company2 Employee Count]),JobCode,DepartmentID))
And while the nested IF statement is 100% correct, I will probably go with a nested RANGEMIN instead, just looks cleaner.
SUM(AGGR(RANGEMIN([Company1 Employee Count],[Company2 Employee Count]),JobCode,DepartmentID))
Thank you for your help!


