Unlock a world of possibilities! Login now and discover the exclusive benefits awaiting you.
- Qlik Community
- :
- Forums
- :
- Analytics & AI
- :
- Products & Topics
- :
- App Development
- :
- Set analysis expression to include all years
- Subscribe to RSS Feed
- Mark Topic as New
- Mark Topic as Read
- Float this Topic for Current User
- Bookmark
- Subscribe
- Mute
- Printer Friendly Page
- Mark as New
- Bookmark
- Subscribe
- Mute
- Subscribe to RSS Feed
- Permalink
- Report Inappropriate Content
Set analysis expression to include all years
I want to modify an expression so it will include all years, and all warehouses for that matter, but it doesn't seem to be working.
Avg(Aggr(Avg({$<Year=,Warehouse=>} MinutesToLoad), SalesOrder))
The expected behavior is that my Distribution Plot chart should always include all years and all warehouses, even if selections have been made in the app. But, when I tested it by selecting a single year, the chart filtered to just that year. Any ideas on what I'm doing wrong?
Thanks.
- « Previous Replies
-
- 1
- 2
- Next Replies »
- Mark as New
- Bookmark
- Subscribe
- Mute
- Subscribe to RSS Feed
- Permalink
- Report Inappropriate Content
You might have to actually repeat the set expression both for the Aggr()-function and the outer Avg()-function for this to work as you expect.
- Mark as New
- Bookmark
- Subscribe
- Mute
- Subscribe to RSS Feed
- Permalink
- Report Inappropriate Content
I'm not sure if I did this right, but here's the modified expression:
Avg({$<Year=,Warehouse=>}Aggr({$<Year=,Warehouse=>} Avg({$<Year=,Warehouse=>} MinutesToLoad), SalesOrder))
It works if I select something from the Year dimension, but once I select a Warehouse the chart filters on the Warehouse. So, it partially works which is an improvement!
Anything else I can do to get it work better?
- Mark as New
- Bookmark
- Subscribe
- Mute
- Subscribe to RSS Feed
- Permalink
- Report Inappropriate Content
Try this
Avg({$<Year, Warehouse>}Aggr(Avg({$<Year, Warehouse>} MinutesToLoad), SalesOrder))
- Mark as New
- Bookmark
- Subscribe
- Mute
- Subscribe to RSS Feed
- Permalink
- Report Inappropriate Content
Still working for Year dimension,but not Warehouse dimension. When I filter on a Warehouse it starts behaving strangely, such as a non-selected warehouse will show up in addition to the selected warehouse, but I just want all warehouses to show up.
- Mark as New
- Bookmark
- Subscribe
- Mute
- Subscribe to RSS Feed
- Permalink
- Report Inappropriate Content
Would you be able to share a sample or sample image to show this? Are you using a calculated dimension for Filter and have you made sure that the field name is Warehouse and not WAREHOUSE or warehouse?
- Mark as New
- Bookmark
- Subscribe
- Mute
- Subscribe to RSS Feed
- Permalink
- Report Inappropriate Content
Warehouse is a calculated dimension but I have also tried with just the Warehouse dimension and get the same behavior. When using the calculated dimension, the calculation is:
=If(Match(Warehouse,'HUR','SAL','SSS','SBF','YUM','YBF','YSS'),Warehouse,Null())
I also have this stored in a Master dimension called PFWarehouse.
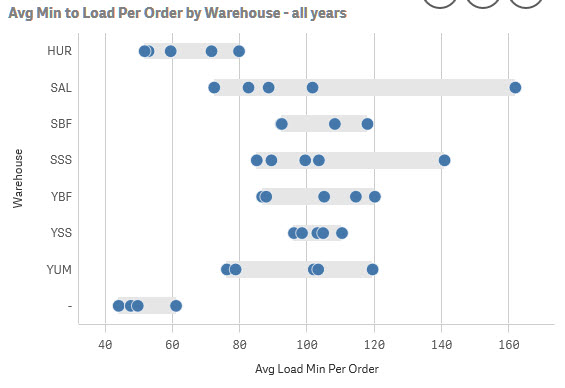
First screen grab shows the calculated dimension, with no warehouses selected
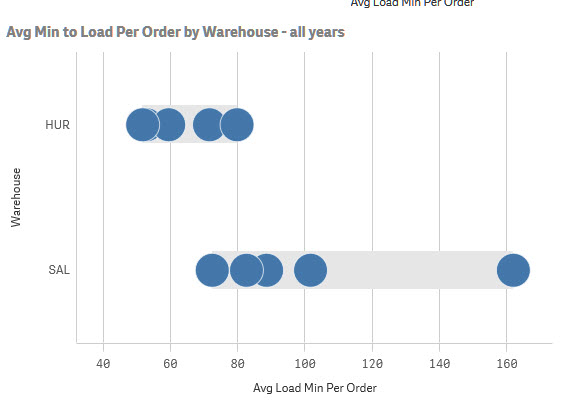
Second screen grab shows the calculated Warehouse dimension with only SAL selected but HUR also shows up.
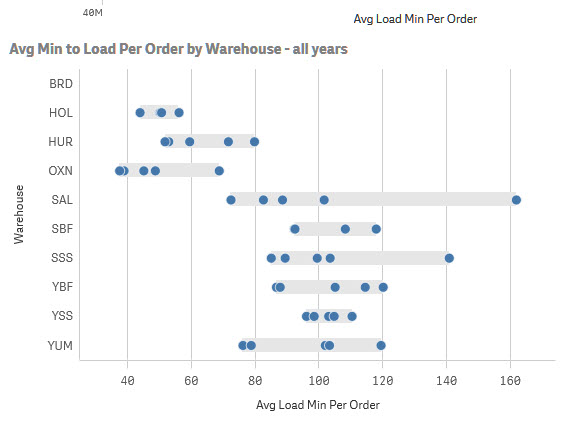
Third screen grab shows the normal Warehouse dimension with no warehouses selected:
And the last screen grab shows the normal Warehouse dimension, with the SAL warehouse selected but BRD and HOL show up instead.
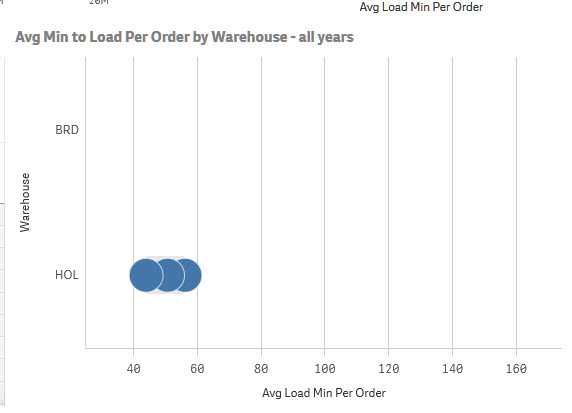
Note: Since my expression for the calculated dimension adds the possibility of a Null result, I will be unchecking the box in the Warehouse dimension that includes null values.
- Mark as New
- Bookmark
- Subscribe
- Mute
- Subscribe to RSS Feed
- Permalink
- Report Inappropriate Content
May be create the filter like this
=Aggr(Only({1<Warehouse = {'HUR', 'SAL', 'SSS', 'SBF', 'YUM', 'YBF', 'YSS'}>} Warehouse), Warehouse)
and then see if the selection in the above filter is ignored by the chart or not
- Mark as New
- Bookmark
- Subscribe
- Mute
- Subscribe to RSS Feed
- Permalink
- Report Inappropriate Content
Very interesting approach! Unfortunately, I'm still getting the same behavior.
- Mark as New
- Bookmark
- Subscribe
- Mute
- Subscribe to RSS Feed
- Permalink
- Report Inappropriate Content
Can you try this with a new field in the script
If(Not Match(Warehouse, 'HUR', 'SAL', 'SSS', 'SBF', 'YUM', 'YBF', 'YSS'), Warehouse, Null()) as New_Warehouse
and not ignore selection in New_Warehouse and use this as your filter?
- « Previous Replies
-
- 1
- 2
- Next Replies »