Unlock a world of possibilities! Login now and discover the exclusive benefits awaiting you.
- Qlik Community
- :
- Forums
- :
- Analytics & AI
- :
- Products & Topics
- :
- App Development
- :
- Set expression to multiply factor based on range
- Subscribe to RSS Feed
- Mark Topic as New
- Mark Topic as Read
- Float this Topic for Current User
- Bookmark
- Subscribe
- Mute
- Printer Friendly Page
- Mark as New
- Bookmark
- Subscribe
- Mute
- Subscribe to RSS Feed
- Permalink
- Report Inappropriate Content
Set expression to multiply factor based on range
Hello,
Below are the table structures I have:
Events:
Load * Inline [
Event, EventDate, EventAmount, EventOnTime, EventHappened
1, 1/1/2017, $100, 1, 1
2, 1/1/2017, $200, 0, 1
3, 1/2/2017, $50, 0, 1
4, 1/31/2017, $500, 1, 1
];
Percent of events that happened on time for the Month of Jan 2017 would be (1+0+0+1)/4=50% (Let this number be called P)
Factor:
Load * Inline [
FactorType, MinPercent, MaxPercent, Factor
A, 0%, 25%, 100%
A, 26%, 75%, 60%
A, 76%, 100%, 0%
];
In the visualization, I have created a line chart which shows the EventAmount by Month and for multiple Years. The chart looks something like like this.
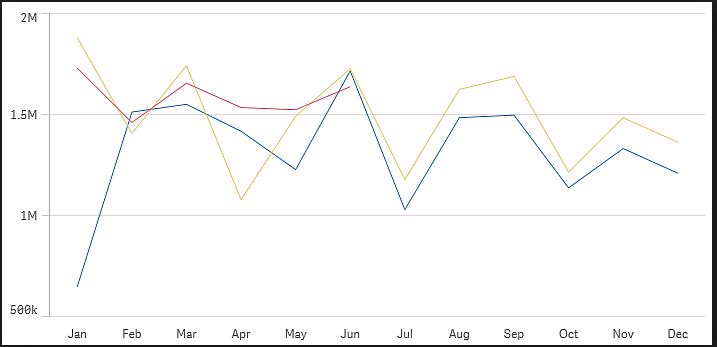
The actual requirement is to multiply the EventAmount by Factor based on the range in which "P" belongs. In this case, for Jan 2017- EventAmount($850)*Factor(60%)=$510. $510 is the number which has to be represented in the line chart.
How to write set expression for the above requirement?
Thanks in advance.
Deepika
- Tags:
- setexpression
- Mark as New
- Bookmark
- Subscribe
- Mute
- Subscribe to RSS Feed
- Permalink
- Report Inappropriate Content
Hello,
try this expression:
=
if(
(aggr ( sum(EventOnTime), monthyear) / count(total EventOnTime) ) <=0.25, 1, if(
(aggr ( sum(EventOnTime), monthyear) / count(total EventOnTime) ) <=0.75, 0.6, if(
(aggr ( sum(EventOnTime), monthyear) / count(total EventOnTime) ) <=1, 0))) * EventAmount
- Mark as New
- Bookmark
- Subscribe
- Mute
- Subscribe to RSS Feed
- Permalink
- Report Inappropriate Content
Is there a possibility to do this without hard-coding the factor values; cause the factor values can change.
- Mark as New
- Bookmark
- Subscribe
- Mute
- Subscribe to RSS Feed
- Permalink
- Report Inappropriate Content
you can add these tables, so the expression is not hardcoded in the dashboard but in the script, it is hard to link it to the Factor table hence there is no identifier to each range
Try these in the script:
Events1:
Load *,
MonthName(Date(EventDate)) as monthyear
resident Events;
drop table Events;
test:
Load
monthyear,
sum(EventOnTime)/ count( EventOnTime) as Factor,
if( sum(EventOnTime)/ count( EventOnTime)<=0.25 , 1,
if(sum(EventOnTime)/ count( EventOnTime)<=0.75 ,0.6 ,
if(sum(EventOnTime)/ count( EventOnTime)<=1 ,0))) as Total11
resident Events1
group By monthyear;