Unlock a world of possibilities! Login now and discover the exclusive benefits awaiting you.
- Qlik Community
- :
- Forums
- :
- Analytics & AI
- :
- Products & Topics
- :
- App Development
- :
- Std Dev in a pivot table
- Subscribe to RSS Feed
- Mark Topic as New
- Mark Topic as Read
- Float this Topic for Current User
- Bookmark
- Subscribe
- Mute
- Printer Friendly Page
- Mark as New
- Bookmark
- Subscribe
- Mute
- Subscribe to RSS Feed
- Permalink
- Report Inappropriate Content
Std Dev in a pivot table
I have a problem where I need to be able to display Standard Deviation in a pivot table. The biggest issue is that it needs to be calculating the standard deviation of the Daily net regardless of the first dimension in the pivot rows.
For example, given the below data:
| Date | Division | Department | Daily Profit |
|---|---|---|---|
| 6/3/2018 | A | A1 | 50 |
| 6/4/2018 | A | A1 | 60 |
| 6/5/2018 | A | A1 | 10 |
| 6/4/2018 | A | A2 | -30 |
| 6/5/2018 | A | A2 | 30 |
In our pivot table, with Divisionas the first dimension in the "Rows" section, it should be taking stdev(50, 30, 40) because we only care about he standard deviation of the daily total values (daily totals shown below).
| Date | Division | Daily TOTAL |
|---|---|---|
| 6/3/2018 | A | 50 |
| 6/4/2018 | A | 30 |
| 6/5/2018 | A | 40 |
With Department as the first dimension in the "Rows" section of the pivot table, it should take stdev(50, 60, 10) for division A1, and stdev(-30, 30) for A2, since these are the daily totals for those divisions.
Any help on which formula I could use to calculate this? Thank you in advance for all help.
If I use the following, then for Division it will take the stdev(50, 60, 10, -30, 30):
stdev(aggr(Sum(Daily Profit),Division,Department,Date))
- Mark as New
- Bookmark
- Subscribe
- Mute
- Subscribe to RSS Feed
- Permalink
- Report Inappropriate Content
Try this
Stdev(Aggr(Sum([Daily Profit]), Date))
- Mark as New
- Bookmark
- Subscribe
- Mute
- Subscribe to RSS Feed
- Permalink
- Report Inappropriate Content
When I try this, many of the Standard Deviation values for Divisions show up as "-". Not sure why this is, but when I filter for a single division, its value will change from "-" to a number even if no other filters are selected. I do not understand why the Standard deviation would change when none of the Daily Profit values under the Division have after filtering.
- Mark as New
- Bookmark
- Subscribe
- Mute
- Subscribe to RSS Feed
- Permalink
- Report Inappropriate Content
Try this
Aggr(NODISTINCT Stdev(Aggr(Sum([Daily Profit]), Date)), Date)
- Mark as New
- Bookmark
- Subscribe
- Mute
- Subscribe to RSS Feed
- Permalink
- Report Inappropriate Content
Or may be this
Stdev(TOTAL Aggr(Sum([Daily Profit]), Date))
- Mark as New
- Bookmark
- Subscribe
- Mute
- Subscribe to RSS Feed
- Permalink
- Report Inappropriate Content
No luck with these either.
Aggr(NODISTINCT Stdev(Aggr(Sum([Daily Profit]), Date)), Date) results in "-" no matter the drilldown level.
Stdev(TOTAL Aggr(Sum([Daily Profit]), Date)) results in all divisions having the same Stdev value, whereas each should have their own independent value.
- Mark as New
- Bookmark
- Subscribe
- Mute
- Subscribe to RSS Feed
- Permalink
- Report Inappropriate Content
Would you be able to share a sample to check this out?
- Mark as New
- Bookmark
- Subscribe
- Mute
- Subscribe to RSS Feed
- Permalink
- Report Inappropriate Content
Hi,
the only way I see is to add Date as dimension :
so use stdev(Daily Profit) as formula !
and use dimensionality() to display stdev and not row daily details
regards
- Mark as New
- Bookmark
- Subscribe
- Mute
- Subscribe to RSS Feed
- Permalink
- Report Inappropriate Content
Hi Elijah,
Is this what you are looking for?
Expression:
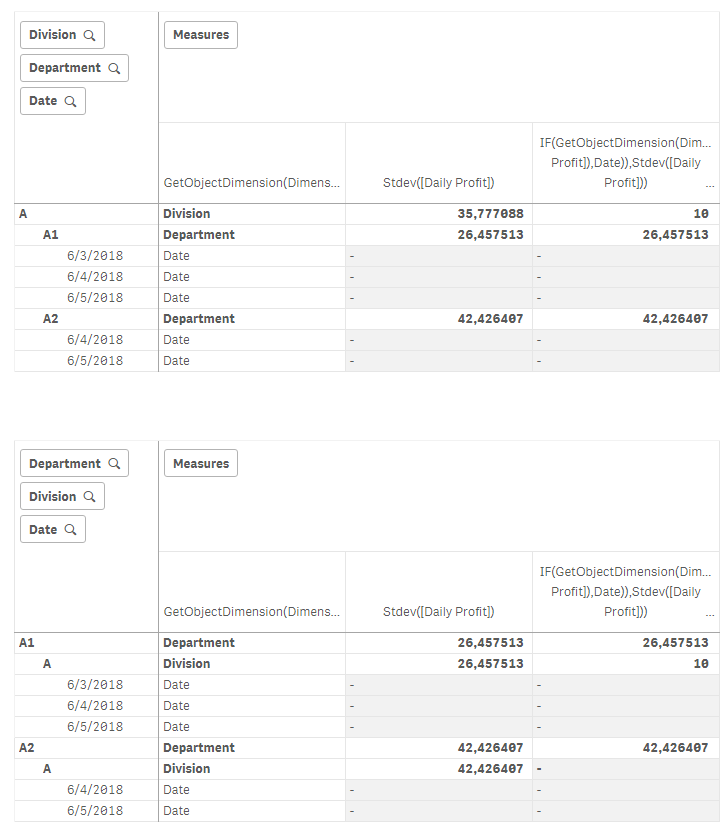
IF(GetObjectDimension(Dimensionality()-1)='Division',Stdev(aggr(sum([Daily Profit]),Date)),Stdev([Daily Profit]))

Hope it helps.
- Mark as New
- Bookmark
- Subscribe
- Mute
- Subscribe to RSS Feed
- Permalink
- Report Inappropriate Content
This works very well for this case, so thank you! Do you know how this solution could be expanded for more than 2 dimensions? Let's say there was a third dimension named "Store" - would there be a way to do this intricately without nested IF statements?
We actually use more than 2 dimensions in the case I'm looking for help on, I just can't post proprietary stuff on here, so I used this example.