Unlock a world of possibilities! Login now and discover the exclusive benefits awaiting you.
- Qlik Community
- :
- Forums
- :
- Analytics & AI
- :
- Products & Topics
- :
- App Development
- :
- Unpivot Data Multiple Times in Qlik Sense
- Subscribe to RSS Feed
- Mark Topic as New
- Mark Topic as Read
- Float this Topic for Current User
- Bookmark
- Subscribe
- Mute
- Printer Friendly Page
- Mark as New
- Bookmark
- Subscribe
- Mute
- Subscribe to RSS Feed
- Permalink
- Report Inappropriate Content
Unpivot Data Multiple Times in Qlik Sense
Hi All,
I have a sample survey data that contains responses from different questions (Q1, Q2 and Q3). Q1 is straight forward questions with Strongly Agree, Agree that kinds of answers. For Q2 and Q3, they are multiple choice questions that allow users to pick more than 1 answer. Also note that user may skip Q2 and go ahead to Q3.
Now, the raw data is stored like below:
User ID Q1 Q2 - Option 1 Q2 - Option 2 Q2 - Option 3 Q3 - Option 1 Q3 - Option 2 Q3 - Option 3
1 Strongly Agree Y Y
2 Disagree Y Y
3 Agree Y Y
4 Strongly Disagree Y
5 Neutral Y Y Y
If my objective is to create a bar chart to show how many user selected option 1/ option 2/ option 3 for Q2 and how many users selected option 1/ option 2/ option 3 for Q3, is that I need to unpivot the data as below? If yes, I would like to rearrange the data as follow for further analysis:
User ID Q1 Q2 - Option Q2 - Response Q3 - Option Q3 - Response
1 Strongly Agree Option 1 Y
1 Strongly Agree Option 2 Y
2 Disagree Option 1 Y
2 Disagree Option 2 Y
3 Agree Option 1 Y
3 Agree Option 3 Y
...
Please correct me if I am wrong, I am not sure if unpivot the data is the only way to achieve my goal to analysis the survey data. Kindly let me know how can I unpivot the data 2 times for Q2 & Q3 responses OR let me know if there is workaround.
Thanks in advance!!!
- Mark as New
- Bookmark
- Subscribe
- Mute
- Subscribe to RSS Feed
- Permalink
- Report Inappropriate Content
Hi All,
Perhaps my question is not clearly illustrated, let me show a sample data set for my original data:
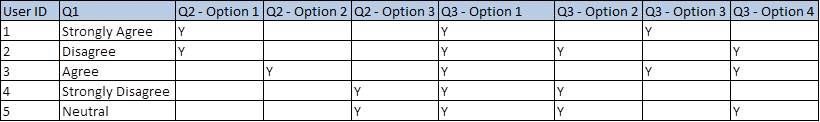
My data set is like above, what I want to do now is to plot a bar chart in QlikSense showing the distribution of the choices for each question. (i.e. how many % of the users selected option 1 in Q2, how many % of the users selected option 2 in Q2, etc.).
Can anyone give me some idea how can I achieve my goal? Is that I have to unpivot my original data set first? If yes, how to unpivot the data few times (assume I have to unpivot the table once for each question)?
Hope it helps to better illustrate my question. Thanks.