Unlock a world of possibilities! Login now and discover the exclusive benefits awaiting you.
- Qlik Community
- :
- Forums
- :
- Analytics & AI
- :
- Products & Topics
- :
- App Development
- :
- Re: Value labels themes
- Subscribe to RSS Feed
- Mark Topic as New
- Mark Topic as Read
- Float this Topic for Current User
- Bookmark
- Subscribe
- Mute
- Printer Friendly Page
- Mark as New
- Bookmark
- Subscribe
- Mute
- Subscribe to RSS Feed
- Permalink
- Report Inappropriate Content
Value labels themes
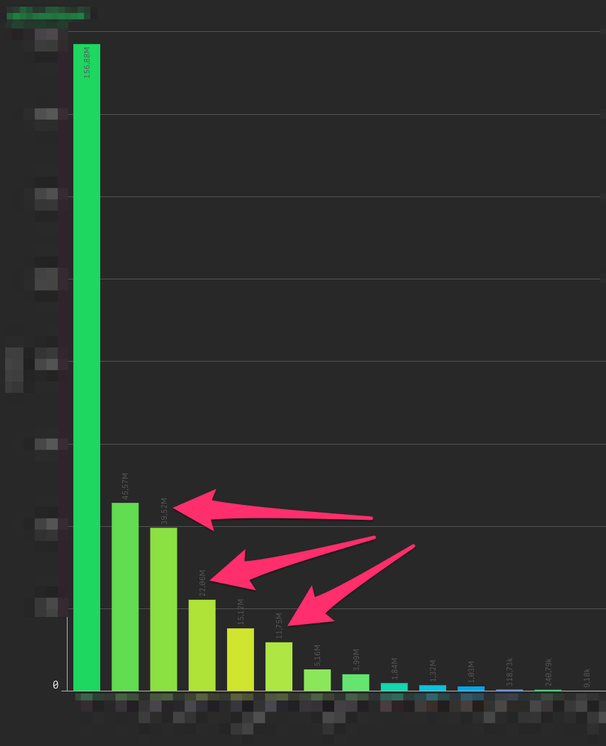
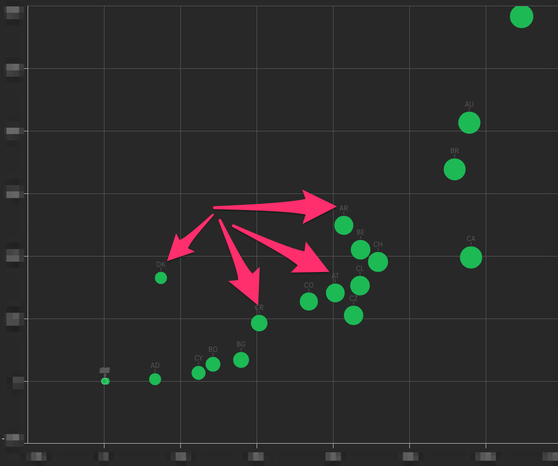
I'm trying to build a dark theme, when using "Value Labels" in charts, they are still dark.
Can't find the name for them when using DeveloperTools in Chrome. Anyone know what the prop is called and how to make it bright?
Accepted Solutions
- Mark as New
- Bookmark
- Subscribe
- Mute
- Subscribe to RSS Feed
- Permalink
- Report Inappropriate Content
Hi,
Add this to your theme (change the color to whatever you want #ffff00 is a yellow):
	"barChart": {
		"label" : {
		  "name" : {
			"color" : "#ffff00"
		  },
		  "value" : {
			"color" : "#ffff00"
		  }
		}
	},
- Mark as New
- Bookmark
- Subscribe
- Mute
- Subscribe to RSS Feed
- Permalink
- Report Inappropriate Content
Hi,
Add this to your theme (change the color to whatever you want #ffff00 is a yellow):
	"barChart": {
		"label" : {
		  "name" : {
			"color" : "#ffff00"
		  },
		  "value" : {
			"color" : "#ffff00"
		  }
		}
	},
- Mark as New
- Bookmark
- Subscribe
- Mute
- Subscribe to RSS Feed
- Permalink
- Report Inappropriate Content
- Mark as New
- Bookmark
- Subscribe
- Mute
- Subscribe to RSS Feed
- Permalink
- Report Inappropriate Content
Does not work for me.. Would rather add some section in the .css.
I've looked at the documentation but must say I don't get the information I need to understand how to build my own theme. Some things I would like the documentation to explain:
- How to understand what the different classes are called.
- Where to find the classes and their child classes.
- include documentation for how to use .css files for themes.
- Mark as New
- Bookmark
- Subscribe
- Mute
- Subscribe to RSS Feed
- Permalink
- Report Inappropriate Content
I haven't found any documentation that explains the standard qlik classes, and generally I find the documentation to be rather frustrating to navigate and to find exactly what I'm looking for. In many cases, code snippets are used where fully working examples would be better for the purpose of better understanding.
So, to find which class to change I look at the element in the developer tools panel. However, this doesn't work for the main data area of charts as it is contained within an impenetrable canvas tag, so we can't see which classes to change.
- Mark as New
- Bookmark
- Subscribe
- Mute
- Subscribe to RSS Feed
- Permalink
- Report Inappropriate Content
I finally managed to make it work.
Need to do one per chart type tho.
my code for this in my .json is now:
"barChart": {
      "label" : {
        "name" : {
        "color" : "@white"
        },
        "value" : {
        "color" : "@white"
        }
      }
    },
    "lineChart": {
      "label" : {
        "name" : {
        "color" : "@white"
        },
        "value" : {
        "color" : "@white"
        }
      }
    },
    "pieChart": {
      "label" : {
        "name" : {
        "color" : "@white"
        },
        "value" : {
        "color" : "@white"
        }
      }
    },
    "scatterPlot": {
      "label" : {
        "name" : {
        "color" : "@white"
        },
        "value" : {
        "color" : "@white"
        }
      }
    },
I can live with that, but it would be even better with a general setting.
- Mark as New
- Bookmark
- Subscribe
- Mute
- Subscribe to RSS Feed
- Permalink
- Report Inappropriate Content
Yes, it needs to be done for each chart type. Glad you managed to find the solution.
There used to be a Canvas Debugger tool in Firefox Developer Edition, but when I downloaded FDE , it looks as though it's been deprecated.
The other options to find out the css class used would be to go through the javascript files to work out which classes are used, but they've been obfuscated. So, the only option left that I can think of would be to go through each class in the css file(s) and alter any that look as though they might be relevant until you find the one that works. As you say, if the classes were documented, it would be simple.
- Mark as New
- Bookmark
- Subscribe
- Mute
- Subscribe to RSS Feed
- Permalink
- Report Inappropriate Content
I have the same problem.
I can even change the background color:
canvas[data-key=bar-labels] {
background-color: yellow;
}
But the value label color I can't get.
I placed the chart in a dark mashup, which made analysis difficult.
- Mark as New
- Bookmark
- Subscribe
- Mute
- Subscribe to RSS Feed
- Permalink
- Report Inappropriate Content
I change the mashup:
I downloaded the theme:
https://github.com/clusterdesign/nightmode-extension
Then set the theme in the mashup.


