Unlock a world of possibilities! Login now and discover the exclusive benefits awaiting you.
- Qlik Community
- :
- Forums
- :
- Analytics & AI
- :
- Products & Topics
- :
- App Development
- :
- stack Bar chart with percentage by dimension
- Subscribe to RSS Feed
- Mark Topic as New
- Mark Topic as Read
- Float this Topic for Current User
- Bookmark
- Subscribe
- Mute
- Printer Friendly Page
- Mark as New
- Bookmark
- Subscribe
- Mute
- Subscribe to RSS Feed
- Permalink
- Report Inappropriate Content
stack Bar chart with percentage by dimension

Dear Experts,
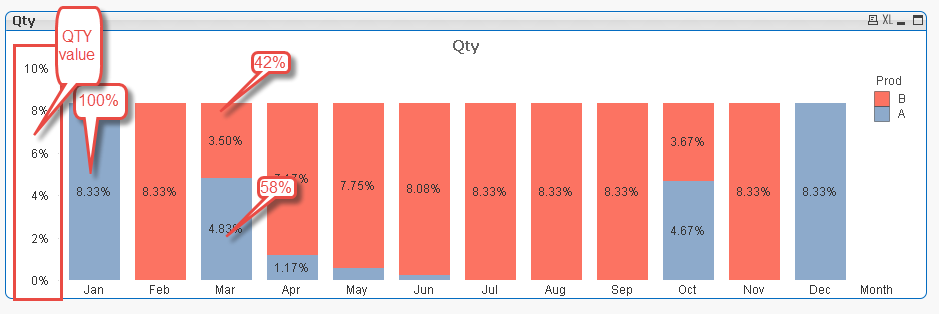
would you please help me to show the percentage of the stack bar chart with percentage by dimension?
if i just check the check box 'value on data points' and 'relative' , it will show percentage, but it is not related to the dimension by month, the whole year is 100%. but i want to make 100% by month.
thanks for your kind help.
Manie
- « Previous Replies
-
- 1
- 2
- Next Replies »
Accepted Solutions
- Mark as New
- Bookmark
- Subscribe
- Mute
- Subscribe to RSS Feed
- Permalink
- Report Inappropriate Content
- Mark as New
- Bookmark
- Subscribe
- Mute
- Subscribe to RSS Feed
- Permalink
- Report Inappropriate Content
My proposal for you
- Mark as New
- Bookmark
- Subscribe
- Mute
- Subscribe to RSS Feed
- Permalink
- Report Inappropriate Content
Dear Enrique,
Thanks for your prompt reply.
However, i want to show the QTY value like 20, 40, 60, 80, 100 on the Y-axis, then on the bar chart , should be 100% in Jan, 100% in Feb, in Mar, A should be 42% and B should be 58%.
thanks,
best regards,
Manie
- Mark as New
- Bookmark
- Subscribe
- Mute
- Subscribe to RSS Feed
- Permalink
- Report Inappropriate Content
Yes, ¿now?
- Mark as New
- Bookmark
- Subscribe
- Mute
- Subscribe to RSS Feed
- Permalink
- Report Inappropriate Content
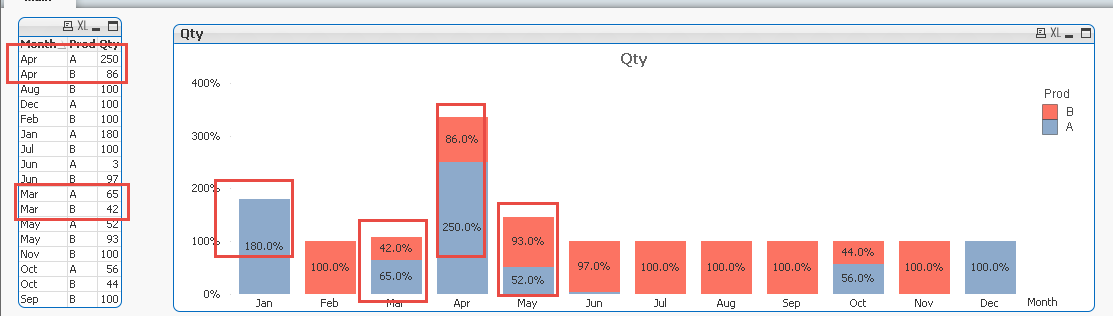
Dear Enrique,
it doesn't work if the total quantity isn't equal to 100, so you can't just divide 100....
P.S. i don't know how to upload QVW in the reply section... so i didn't attach the QVW...
thanks,
best regards,
Manie
- Mark as New
- Bookmark
- Subscribe
- Mute
- Subscribe to RSS Feed
- Permalink
- Report Inappropriate Content
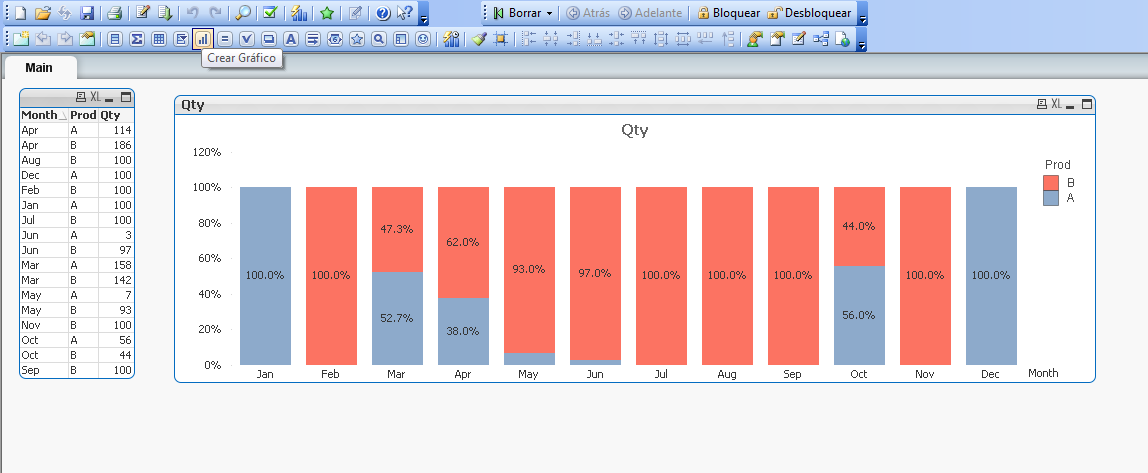
To attach a file you need select in the corner up in right (avanced editor) and then you have the option to upload a file
- Mark as New
- Bookmark
- Subscribe
- Mute
- Subscribe to RSS Feed
- Permalink
- Report Inappropriate Content
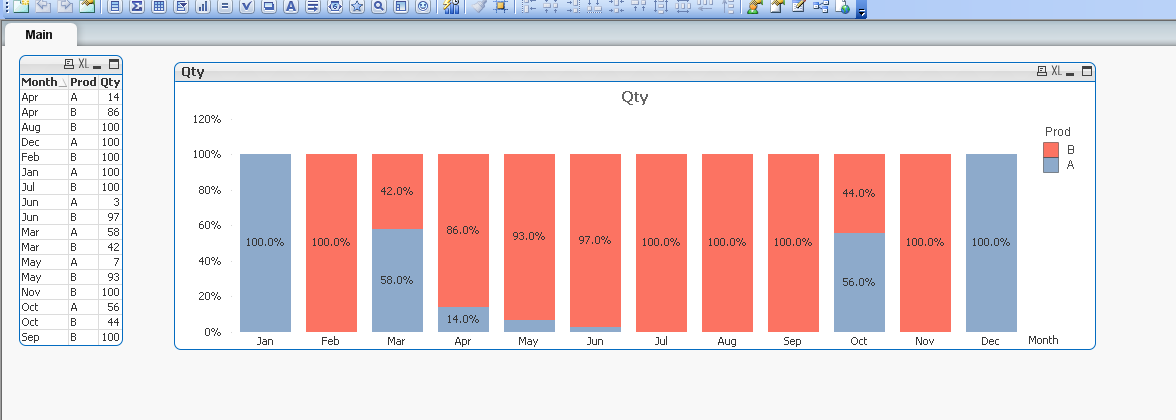
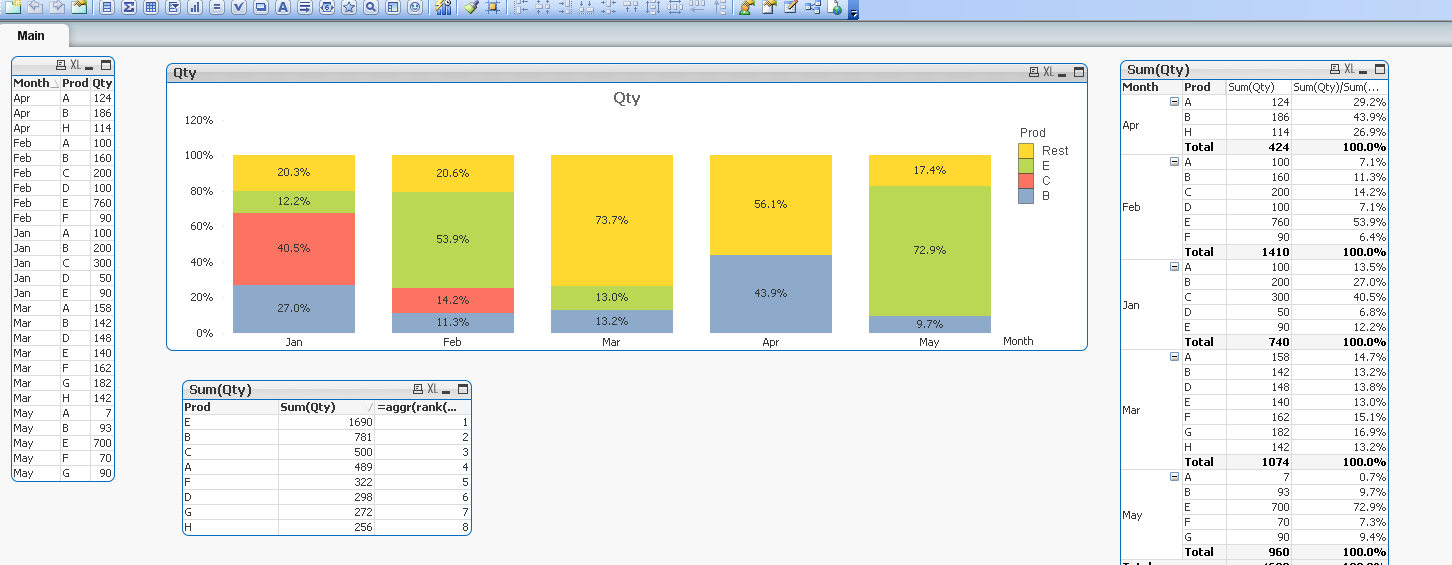
In the expression:
Sum(Qty)/Sum( TOTAL <Month> Qty)
And Number select %
- Mark as New
- Bookmark
- Subscribe
- Mute
- Subscribe to RSS Feed
- Permalink
- Report Inappropriate Content
Dear Enrique,
it works on your simulation, but i try, it didn't work on my dashboard.
Please find the attachment, i have make it a little bit complicate:
we need to show two groups of product in legend: 'top 3 product' as one group and the others exclude by top 3 belongs to 'others'
and the top 3 product is base on monthly sales, not yearly sales, which means the top 3 customer in Apr, is based on Apr's QTY, not whole year's QTY.
it should looks like this: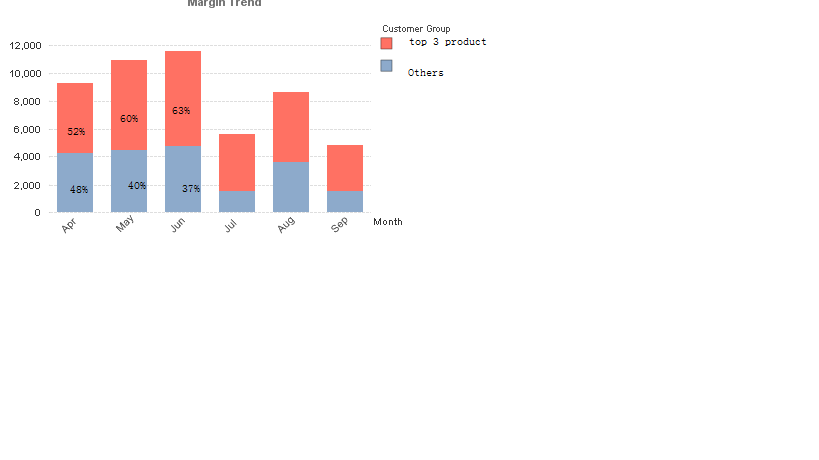
so would you help?
thanks,
best regards,
Manie
- Mark as New
- Bookmark
- Subscribe
- Mute
- Subscribe to RSS Feed
- Permalink
- Report Inappropriate Content
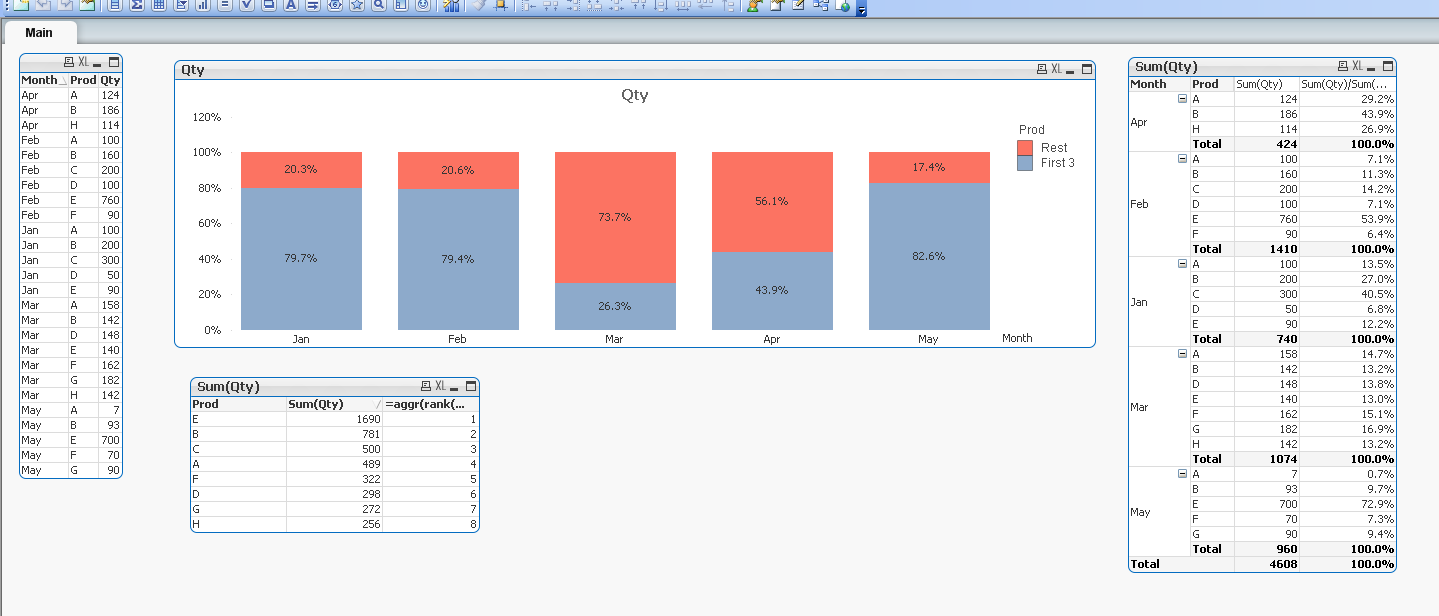
Now?
- Mark as New
- Bookmark
- Subscribe
- Mute
- Subscribe to RSS Feed
- Permalink
- Report Inappropriate Content
Or that?
- « Previous Replies
-
- 1
- 2
- Next Replies »