Unlock a world of possibilities! Login now and discover the exclusive benefits awaiting you.
- Qlik Community
- :
- Forums
- :
- Analytics
- :
- App Development
- :
- Re: 'value colors' from June 2017 release are grey...
- Subscribe to RSS Feed
- Mark Topic as New
- Mark Topic as Read
- Float this Topic for Current User
- Bookmark
- Subscribe
- Mute
- Printer Friendly Page
- Mark as New
- Bookmark
- Subscribe
- Mute
- Subscribe to RSS Feed
- Permalink
- Report Inappropriate Content
'value colors' from June 2017 release are grey on calculated dimension
Hello,
I am trying to use the new value colours function. as an example I'm using some dummy data and I'm trying to colour my top 3 sales guys individually.
I have this calculated dimension:
=if((aggr(rank(sum(Sales)),EmployeeName)<=3),EmployeeName)
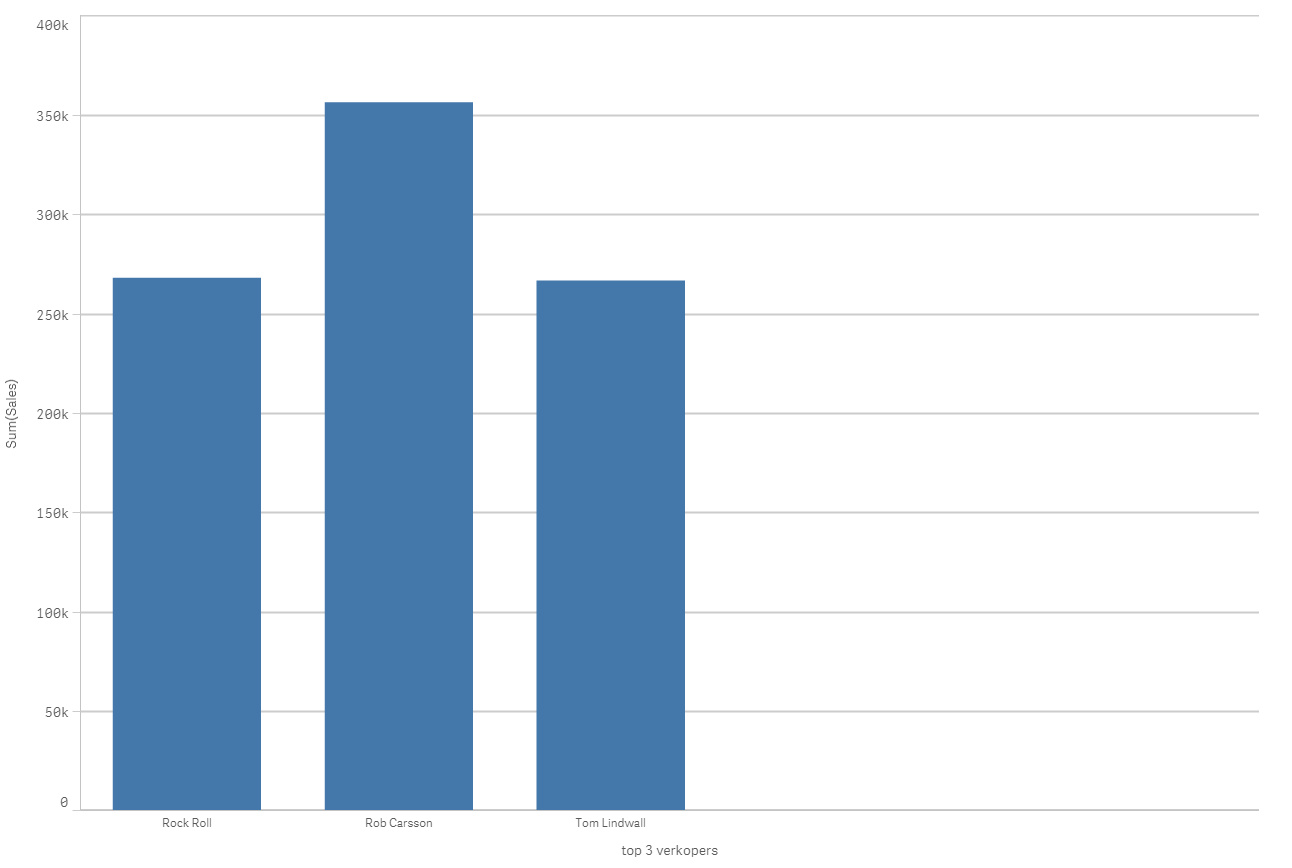
Which works as you can see by this simple bar chart:
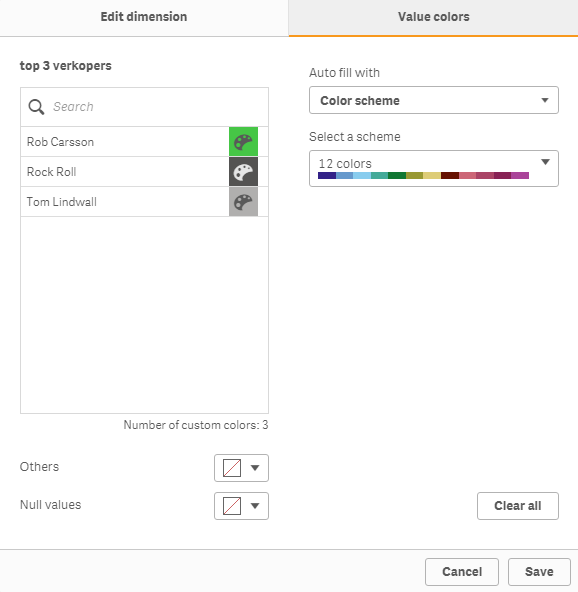
Now I'm trying to use the new functionality:

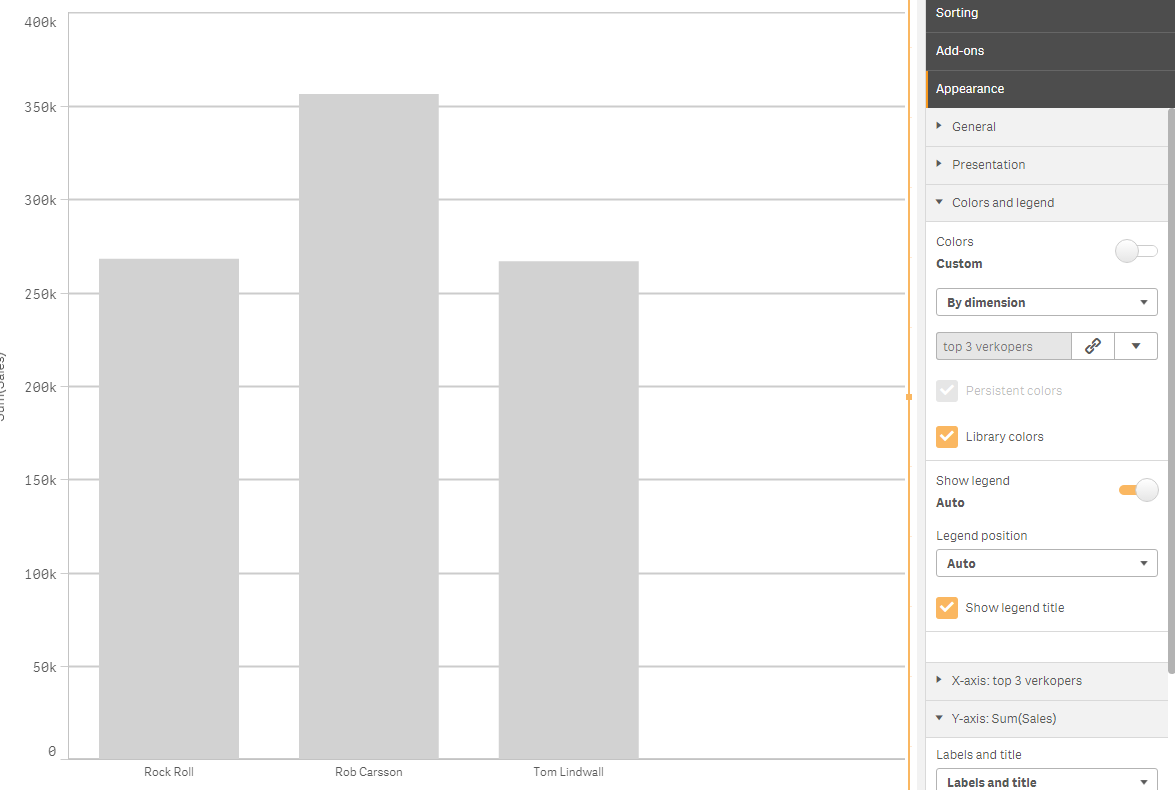
But when I use the colour by dimension option, everything turns grey.

I did find a work around for my problem by using all employees as a dimension and colouring the employees in question in that dimension, but I feel like it should be possible in the way I was trying originally.
Any thoughts?
- Mark as New
- Bookmark
- Subscribe
- Mute
- Subscribe to RSS Feed
- Permalink
- Report Inappropriate Content
I was getting some quirky behavior as well with this new feature and found that in order to get my Library Colors to actually apply I had to drag my Master Dimension from the sidebar onto the object and choose the "Color by: <<Dimension Name>>" option. Once I did this my Library colors actually worked as expected.
- Mark as New
- Bookmark
- Subscribe
- Mute
- Subscribe to RSS Feed
- Permalink
- Report Inappropriate Content
I gave the 'others' and 'null' options a recognisable colour and discovered that it's giving them null colours. So somehow my formula is evaluating to null, even though it's giving me the correct results for my chart.
I've tried wrapping it in another if statement to try to fix it:
=if(isnull(if((aggr(rank(sum(Sales)),EmployeeName)<=3),EmployeeName)),null(),if((aggr(rank(sum(Sales)),EmployeeName)<=3),EmployeeName))
Unfortunately it's not working...
- Mark as New
- Bookmark
- Subscribe
- Mute
- Subscribe to RSS Feed
- Permalink
- Report Inappropriate Content
We had the same error. We tried to apply custom colors to a Dimension called "Company", but the outcome was a chart with grey colors only.
I think the problem was that there is a field in our data model with the same name as the master dimension "Company". After creating a new master dimension with a different name "CompandyDIM" the colors where displayed correctly.