Unlock a world of possibilities! Login now and discover the exclusive benefits awaiting you.
- Qlik Community
- :
- Forums
- :
- Groups
- :
- Location and Language
- :
- Brasil
- :
- Re: Ajuda SetAnalysis Conjuntos
- Subscribe to RSS Feed
- Mark Topic as New
- Mark Topic as Read
- Float this Topic for Current User
- Bookmark
- Subscribe
- Mute
- Printer Friendly Page
- Feature this Topic
- Mark as New
- Bookmark
- Subscribe
- Mute
- Subscribe to RSS Feed
- Permalink
- Report Inappropriate Content
Ajuda SetAnalysis Conjuntos
Bom dia pessoal;
Quero fazer um gráfico assim no meu aplicativo, com uma fórmula pra cada segmento, onde teremos na ordem:
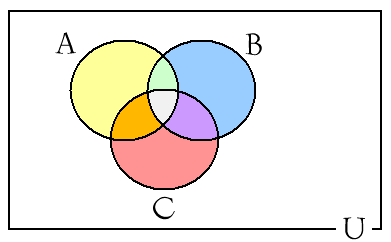
Amarelo – clientes que so compram produtos da linha A
Azul – clientes que so compram produtos da linha B
Vermelho - clientes que so compram produtos da linha C
Laranja - clientes que so compram produtos da linha A e C
Verde - clientes que so compram produtos da linha A e B
Violeta - clientes que so compram produtos da linha B e C
Branco – clientes que compram produtos das linhas A, B e C.
Em anexo coloquei um aplicativo com algumas tabelas de exemplo, imaginam como ficariam as fórmulas ?
Accepted Solutions
- Mark as New
- Bookmark
- Subscribe
- Mute
- Subscribe to RSS Feed
- Permalink
- Report Inappropriate Content
Fiz um exemplo considerando apenas as CategoryID 6(A),7(B) e 8(C) para ficar mais simples.
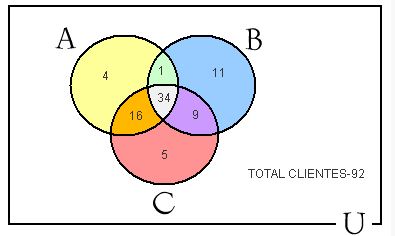
As formulas ficaram assim, acho que deu certo:
Amarelo: =count (distinct {<CustomerID = P ({<CategoryID ={"6"}>} CustomerID ) >*<CustomerID = E ({<CategoryID = {"7"}>} CustomerID ) >*<CustomerID = E ({<CategoryID = {"8"}>} CustomerID ) > } CustomerID )
Azul: =count (distinct {<CustomerID = E ({<CategoryID ={"6"}>} CustomerID ) >*<CustomerID = E ({<CategoryID = {"7"}>} CustomerID ) >*<CustomerID = P ({<CategoryID = {"8"}>} CustomerID ) > } CustomerID )
Vermelho: =count (distinct {<CustomerID = E ({<CategoryID ={"6"}>} CustomerID ) >*<CustomerID = P ({<CategoryID = {"7"}>} CustomerID ) >*<CustomerID = E ({<CategoryID = {"8"}>} CustomerID ) > } CustomerID )
Laranja: =count (distinct {<CustomerID = P ({<CategoryID ={"6"}>} CustomerID ) >*<CustomerID = E ({<CategoryID = {"7"}>} CustomerID ) >*<CustomerID = P ({<CategoryID = {"8"}>} CustomerID ) > } CustomerID )
Verde: =count (distinct {<CustomerID = P ({<CategoryID ={"6"}>} CustomerID ) >*<CustomerID = P ({<CategoryID = {"7"}>} CustomerID ) >*<CustomerID = E ({<CategoryID = {"8"}>} CustomerID ) > } CustomerID )
Roxo: =count (distinct {<CustomerID = E ({<CategoryID ={"6"}>} CustomerID ) >*<CustomerID = P ({<CategoryID = {"7"}>} CustomerID ) >*<CustomerID = P ({<CategoryID = {"8"}>} CustomerID ) > } CustomerID )
Branco: =count (distinct {<CustomerID = P ({<CategoryID ={"6"}>} CustomerID ) >*<CustomerID = P ({<CategoryID = {"7"}>} CustomerID ) >*<CustomerID = P ({<CategoryID = {"8"}>} CustomerID ) > } CustomerID )
- Mark as New
- Bookmark
- Subscribe
- Mute
- Subscribe to RSS Feed
- Permalink
- Report Inappropriate Content
Para saber quantos compraram por produtos,,
//só compraram produto linha A
count({<produto_linha={'A'}>} cliente)
//só compraram produto linha A e B
count({<produto_linha={'A','B'}>} cliente)
//só compraram tudo menos produto linha A
count({<produto_linha-={'A'}>} cliente)
Basta transformar para sua aplicação..
- Mark as New
- Bookmark
- Subscribe
- Mute
- Subscribe to RSS Feed
- Permalink
- Report Inappropriate Content
Lembrando que para cada cor.. é um expressão
- Mark as New
- Bookmark
- Subscribe
- Mute
- Subscribe to RSS Feed
- Permalink
- Report Inappropriate Content
Ola Eduardo;
Não é tão simples assim, dessa maneira ele conta quem comprou no A, mas o cliente pode ter comprado em B também....e eu quero somente tenha comprado em A.
Ah, faltou o Distinct também...
Com o exemplo que passei anexo fica mais fácil perceber o problema.
- Mark as New
- Bookmark
- Subscribe
- Mute
- Subscribe to RSS Feed
- Permalink
- Report Inappropriate Content
Olá Cléber,
Montei uma expressão em cima do seu modelo e funcionou, só não apliquei no gráfico.
Segue:
SUM(If(CategoryID = 1, If(Aggr(Count(DISTINCT CategoryID),CustomerID)=1, CategoryID),
If(CategoryID = 2, If(Aggr(Count(DISTINCT CategoryID),CustomerID)=1, CategoryID),
If(CategoryID = 3, If(Aggr(Count(DISTINCT CategoryID),CustomerID)=1, CategoryID),
If(CategoryID = 4, If(Aggr(Count(DISTINCT CategoryID),CustomerID)=1, CategoryID),
If(CategoryID = 5, If(Aggr(Count(DISTINCT CategoryID),CustomerID)=1, CategoryID),
If(CategoryID = 6, If(Aggr(Count(DISTINCT CategoryID),CustomerID)=1, CategoryID),
If(CategoryID = 7, If(Aggr(Count(DISTINCT CategoryID),CustomerID)=1, CategoryID),
If(CategoryID = 8, If(Aggr(Count(DISTINCT CategoryID),CustomerID)=1, CategoryID),0)))))))))
O resultado foi o seguinte:

- Mark as New
- Bookmark
- Subscribe
- Mute
- Subscribe to RSS Feed
- Permalink
- Report Inappropriate Content
Bom dia Cristiano !
Apliquei aqui a sua fórmula no aplicativo do exemplo, porem num objeto de texto, que é onde terei os diversos 'segmentos' de contagem.
o primeiro objeto de texto contemplará os clientes que somente compraram produtos da Categoria 1:
=SUM(If(CategoryID = 1, If(Aggr(Count(DISTINCT CategoryID),CustomerID)=1, CategoryID),0))
Isso me mostrou o valor 2, igual ao da tabela que me passou acima.
Porém percebi que ao fazer seleção no filtro do campo CategoryID o valor exibido muda, mostrando 70 caso selecione o Categoria 1.
Além disso, como ficariam as intersecções ? Tentei fazer aqui usando AND no IF mas não funcionou...
- Mark as New
- Bookmark
- Subscribe
- Mute
- Subscribe to RSS Feed
- Permalink
- Report Inappropriate Content
Sei que não é essa a solução que vc precisa, mas talvez possa te ajudar.
us-b.demo.qlik.com/detail.aspx?appName=Prescription%20Tracker.qvw
obs: Incluir o "http:"
Abs.
- Mark as New
- Bookmark
- Subscribe
- Mute
- Subscribe to RSS Feed
- Permalink
- Report Inappropriate Content
Fiz um exemplo considerando apenas as CategoryID 6(A),7(B) e 8(C) para ficar mais simples.
As formulas ficaram assim, acho que deu certo:
Amarelo: =count (distinct {<CustomerID = P ({<CategoryID ={"6"}>} CustomerID ) >*<CustomerID = E ({<CategoryID = {"7"}>} CustomerID ) >*<CustomerID = E ({<CategoryID = {"8"}>} CustomerID ) > } CustomerID )
Azul: =count (distinct {<CustomerID = E ({<CategoryID ={"6"}>} CustomerID ) >*<CustomerID = E ({<CategoryID = {"7"}>} CustomerID ) >*<CustomerID = P ({<CategoryID = {"8"}>} CustomerID ) > } CustomerID )
Vermelho: =count (distinct {<CustomerID = E ({<CategoryID ={"6"}>} CustomerID ) >*<CustomerID = P ({<CategoryID = {"7"}>} CustomerID ) >*<CustomerID = E ({<CategoryID = {"8"}>} CustomerID ) > } CustomerID )
Laranja: =count (distinct {<CustomerID = P ({<CategoryID ={"6"}>} CustomerID ) >*<CustomerID = E ({<CategoryID = {"7"}>} CustomerID ) >*<CustomerID = P ({<CategoryID = {"8"}>} CustomerID ) > } CustomerID )
Verde: =count (distinct {<CustomerID = P ({<CategoryID ={"6"}>} CustomerID ) >*<CustomerID = P ({<CategoryID = {"7"}>} CustomerID ) >*<CustomerID = E ({<CategoryID = {"8"}>} CustomerID ) > } CustomerID )
Roxo: =count (distinct {<CustomerID = E ({<CategoryID ={"6"}>} CustomerID ) >*<CustomerID = P ({<CategoryID = {"7"}>} CustomerID ) >*<CustomerID = P ({<CategoryID = {"8"}>} CustomerID ) > } CustomerID )
Branco: =count (distinct {<CustomerID = P ({<CategoryID ={"6"}>} CustomerID ) >*<CustomerID = P ({<CategoryID = {"7"}>} CustomerID ) >*<CustomerID = P ({<CategoryID = {"8"}>} CustomerID ) > } CustomerID )