Unlock a world of possibilities! Login now and discover the exclusive benefits awaiting you.
Announcements
Accelerate Your Success: Fuel your data and AI journey with the right services, delivered by our experts.
Learn More
- Qlik Community
- :
- Forums
- :
- Groups
- :
- Location and Language
- :
- Brasil
- :
- Gráfico de barras em percentual
Options
- Subscribe to RSS Feed
- Mark Topic as New
- Mark Topic as Read
- Float this Topic for Current User
- Bookmark
- Subscribe
- Mute
- Printer Friendly Page
- Feature this Topic
Turn on suggestions
Auto-suggest helps you quickly narrow down your search results by suggesting possible matches as you type.
Showing results for
Not applicable
2016-12-15
08:34 PM
- Mark as New
- Bookmark
- Subscribe
- Mute
- Subscribe to RSS Feed
- Permalink
- Report Inappropriate Content
Gráfico de barras em percentual
Como fazer para um gráfico de barras mostrar valores em percentual?
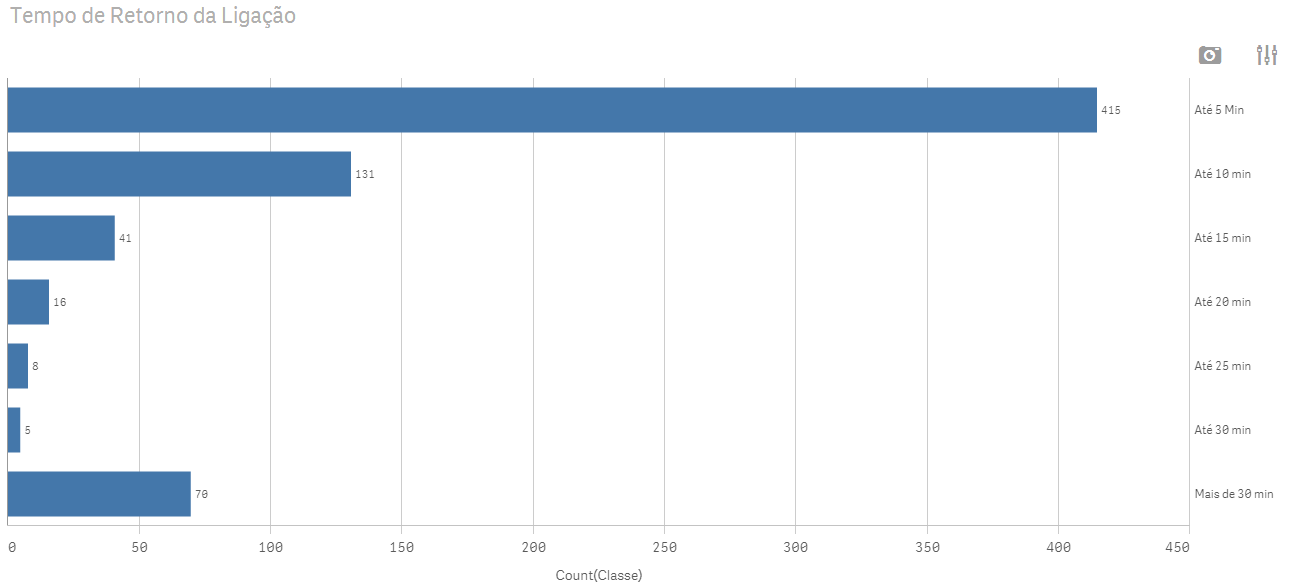
No exemplo:
Dimensão = Classe
Medida = Count(Classe)
Agradeço antecipadamente as respostas.
1,687 Views
1 Solution
Accepted Solutions
Master III
2016-12-16
02:07 AM
- Mark as New
- Bookmark
- Subscribe
- Mute
- Subscribe to RSS Feed
- Permalink
- Report Inappropriate Content
2 Replies
Master III
2016-12-16
02:07 AM
- Mark as New
- Bookmark
- Subscribe
- Mute
- Subscribe to RSS Feed
- Permalink
- Report Inappropriate Content
Try:
Medida = Count(Classe)/Count(TOTAL Classe)
Not applicable
2016-12-16
06:59 AM
Author
- Mark as New
- Bookmark
- Subscribe
- Mute
- Subscribe to RSS Feed
- Permalink
- Report Inappropriate Content
Thanks
1,083 Views