Unlock a world of possibilities! Login now and discover the exclusive benefits awaiting you.
- Qlik Community
- :
- Forums
- :
- Groups
- :
- Location and Language
- :
- Brasil
- :
- Is it cold in here? Nice! Let's increase your sell...
- Subscribe to RSS Feed
- Mark Topic as New
- Mark Topic as Read
- Float this Topic for Current User
- Bookmark
- Subscribe
- Mute
- Printer Friendly Page
- Feature this Topic
- Mark as New
- Bookmark
- Subscribe
- Mute
- Subscribe to RSS Feed
- Permalink
- Report Inappropriate Content
Is it cold in here? Nice! Let's increase your selling!
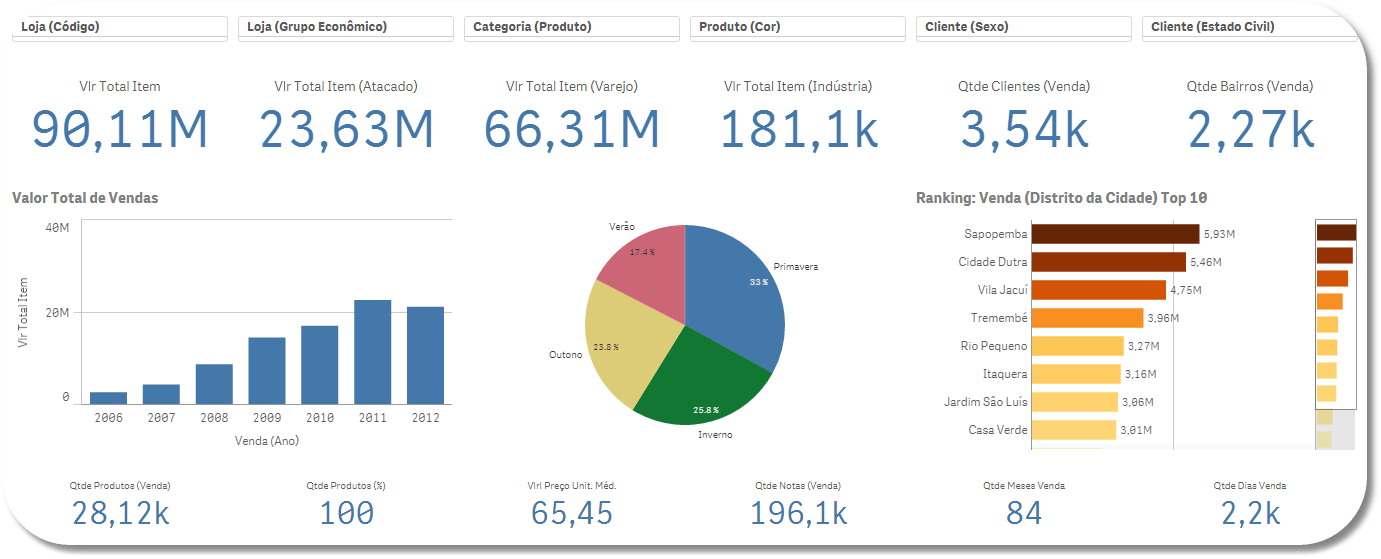
Nowadays, I'm working with Data Analytics to get more delivery accuracy of products and projects. One of the projects we recently delivered was about a "Retailing Company" which sells clothes and accessories. We've created mobile apps for live selling on the streets with sellers crossing the city by cars and motorbikes.
The first challenge was to create an adequate Data Warehouse with clear and correct information. Our customer needs were to get more information of his consumers and we use mobile solutions to update the main database and he gave some discount benefits during the selling process.
Afterwards, we used Qlik Sense to deliver the visualizations to keep the analysis up to date according to the company's strategy. The customer was amazed with the simplicity of the presented data. He told me about the main goals of analysis and I've created with the team the Data Model and suggested some strategic KPIs for complementing the comprehension with his business products.
The customer authorized by himself to publish this success case, but I will not write about his strategic dashboards just because they are very sensitive for his business segment.
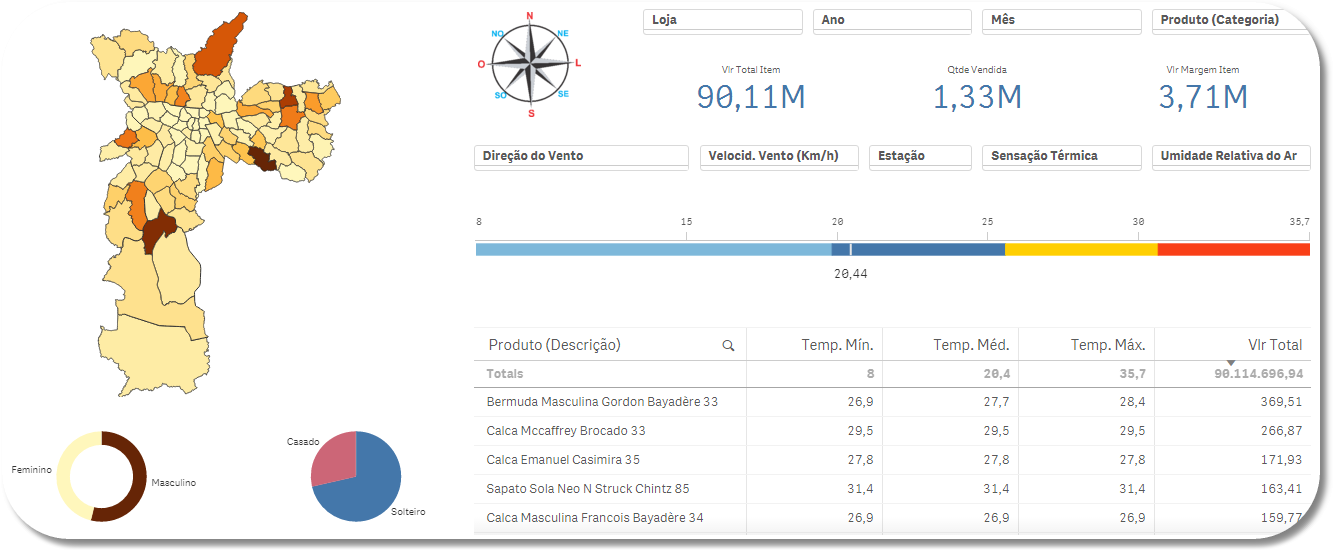
After the primary results, we were asked about the accuracy of the data. Some clothes for winter, for example, were bestselling during summer. "If is this correct, please tell me what's wrong?" Said the CEO. We checked the data again and again and concluded that were correct and informed the analysis to the company. The CEO accepted the criteria, but was not satisfied with the inconclusive explanation of the cause.
As people who live in São Paulo may know, the weather in here is a kind of crazy. We can have the four seasons during a day. That unpredictable fact about the predictable gave us the idea about cross the selling data with the historical results of the weather by each district of the city.
The data could be analyzed by several dimensions:
- Temperature;
- Year (comparing to others);
- Month and its evolution;
- Season of the year;
- Relative humidity;
- Air direction;
- Air speed;
- Customers by: sex, age and marital status.
The functionality was incorporated to the company marketing campaign and the weather forecast on the TV news is now the most important audience for the managers and for the CEO.
Few days later, they concluded about the new vision of the company data:
- The amount of products is increased by low temperature with lower wind speed;
- Hours with lower humidity decreases exponentially the sales on all regions;
- Single men buy more than any other kind of customers' combinations;
- Women buy more when the heat is on.
We've created web services based on geojson standards to populate the maps about the city districts. São Paulo has about two thousand neighborhoods distributed on ninety six districts and the mobile app capture the global position during the selling even if the customer is his or her home and the information is synced with the database. The service classify the position into neighborhood coordinates inside the visualizations.
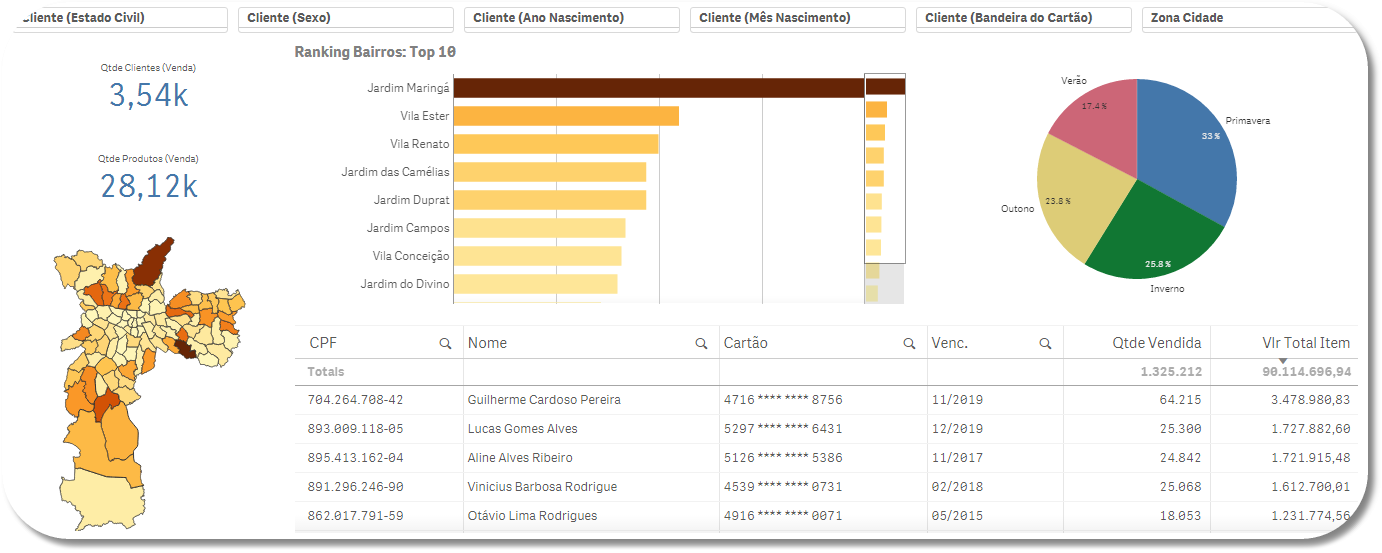
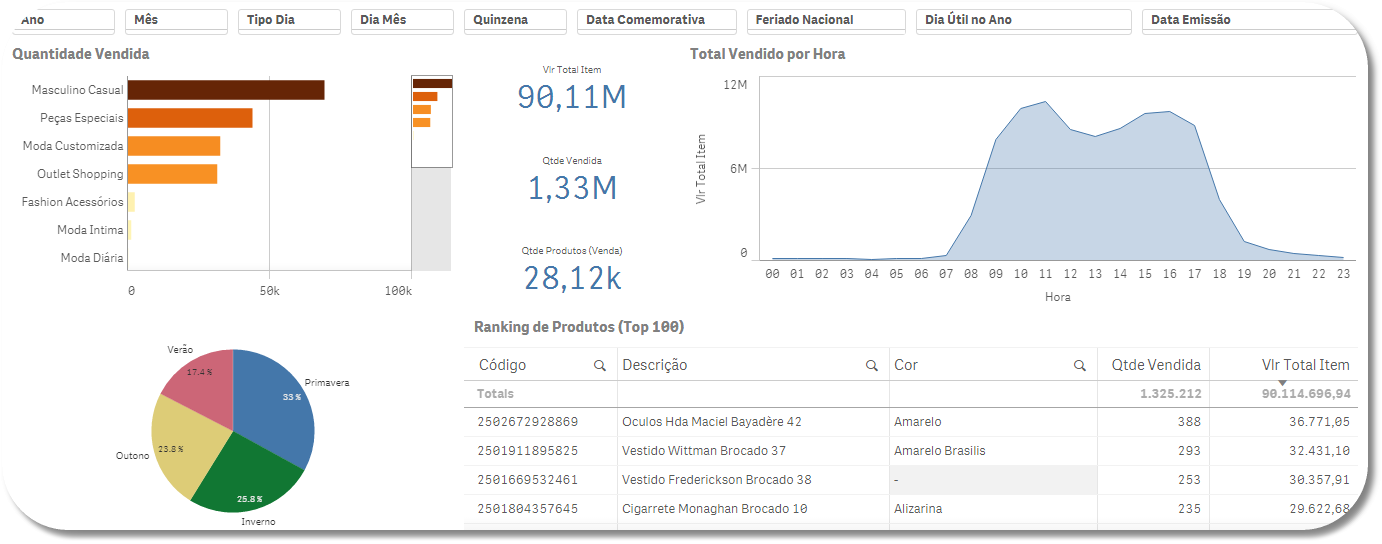
The result was very satisfactory and the customer just couldn't believe on what's happening inside the selling processes. The greatest amount of sales was very far from the physical stores and the sellers' regions wasn't covered by that area. The products market share by season of the year, including holidays. The analysis is about the week day and the month evolution of the selling.
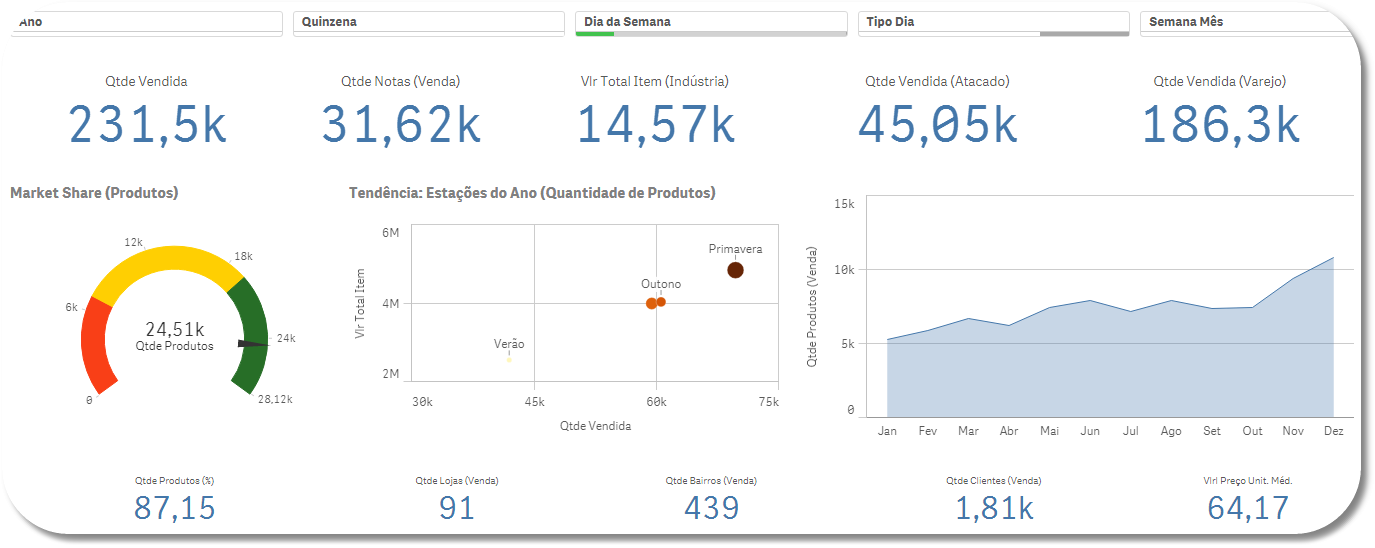
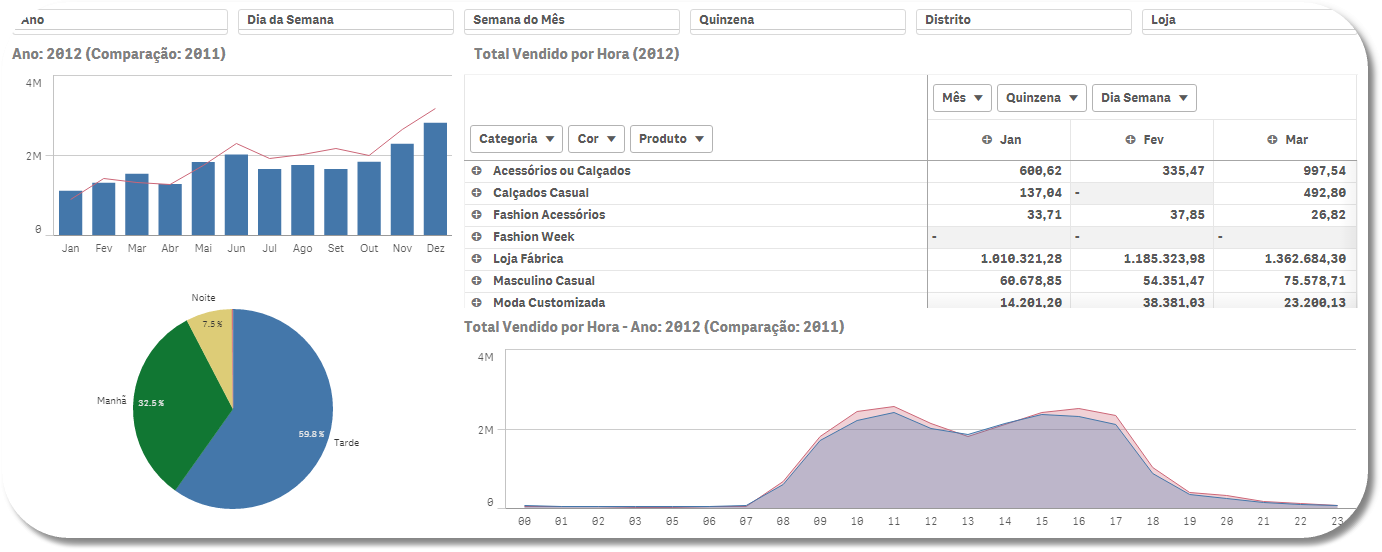
Selling results of each hour according to day by day analysis were involved during the seasons of the year and compared with the results inside the districts of the town.
Comparative periods were optimized during cross companies segments around the districts, such as other industries selling the same products. That strategy gave to the CEO the insight about the opportunity of the company position related to the product distribution in the neighborhoods. They contacted a good marketing campaign to increase the product acceptation and get valuable information about the selling on each region.
For now on, every night all the managers, marketing people, main board directory of the company watch the weather forecast to prepare the products for the selling of the next day.
The stocked product which was not sold during last year was offered with special prices to the good customers distributed by city districts and now the stock is up to date according to the weather movement.
Discover your data and increase your results with the correct Data Analytics!
- Subscribe by Topic:
-
Data Model
-
expression
-
Maps
-
Mobile
-
Qlik Sense
-
Scripting
-
Set Analysis