Unlock a world of possibilities! Login now and discover the exclusive benefits awaiting you.
- Qlik Community
- :
- Forums
- :
- Groups
- :
- Location and Language
- :
- Español
- :
- How to get a Double Gauge
- Subscribe to RSS Feed
- Mark Topic as New
- Mark Topic as Read
- Float this Topic for Current User
- Bookmark
- Subscribe
- Mute
- Printer Friendly Page
- Feature this Topic
- Mark as New
- Bookmark
- Subscribe
- Mute
- Subscribe to RSS Feed
- Permalink
- Report Inappropriate Content
How to get a Double Gauge
Sometimes in a dashboard it is needed to show different but similar KPI, for instance the ratio of deliveries and the ratio of deliveries on time. In these cases we could use one gauge for each KPI. However, we could go further in the design and merge both in one under a flat and friendly design, saving space and giving a direct visual comparison between them.
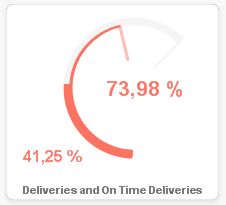
You will need to create separeted gauges, same size and same configuration. Just change expressions and for the one with lowest measure:
- Set color background transparency 100% (Colors tab).
- Set inside Area a little lower than in he other gauge (Presentation tab).
- Set order layer upper than in he other gauge (Design tab).
Then add text boxes with numeric values and package all in one.
Enjoy it!
-----
En ocasiones se necesita mostrar en un panel de control indicadores distintos pero similares, como por ejemplo el porcentaje de entregas y el porcentaje de entregas en plazo. En estos casos podríamos utilizar un indicador de reloj para cada uno. Sin embargo, podemos ir más allá en su diseño y fusionarlos en un solo indicador con un diseño liso y agradable, ahorrando así espacio y ofreciendo una comparación directa entre ellos.
Tendrás que crear objetos de indicador distintos y del mismo tamaño y configuración. Solamente debes cambiar las expresiones y hacer los siguientes ajustes para el indicador de menor valor:
- Transparencia del color de fondo al 100% (pestaña Colores).
- Porcentaje de Área interior levemente menor que la del otro objeto (pestaña Presentación).
- Selecciona una capa superior a la del otro objeto (pestaña Diseño).
Después añade objetos de texto con los valores numéricos y júntalo todo.
Disfrutadlo!