Unlock a world of possibilities! Login now and discover the exclusive benefits awaiting you.
- Qlik Community
- :
- Forums
- :
- Analytics
- :
- New to Qlik Analytics
- :
- 12M Rolling Chart
- Subscribe to RSS Feed
- Mark Topic as New
- Mark Topic as Read
- Float this Topic for Current User
- Bookmark
- Subscribe
- Mute
- Printer Friendly Page
- Mark as New
- Bookmark
- Subscribe
- Mute
- Subscribe to RSS Feed
- Permalink
- Report Inappropriate Content
12M Rolling Chart
Can you please help with the below expression
I have created a bar chart to show data for 12 Month Rolling Period.
Without any filtering, I see the data rolled for 12 Months correctly.
But once I start, selecting the values in the Filter the Dashboard doesn't filter correctly to show 12month it selects from the month selected and forward. please help.
Max(Report Date) = '7/31/2017'
sum(
{<
[Report Year]=,
[Report Month]=,
[Report Date]={'>=$(=MonthStart(Max([Report Date]),-11))<=$(Date(Max([Report Date])))'}
>}
NetFlows)/1000000
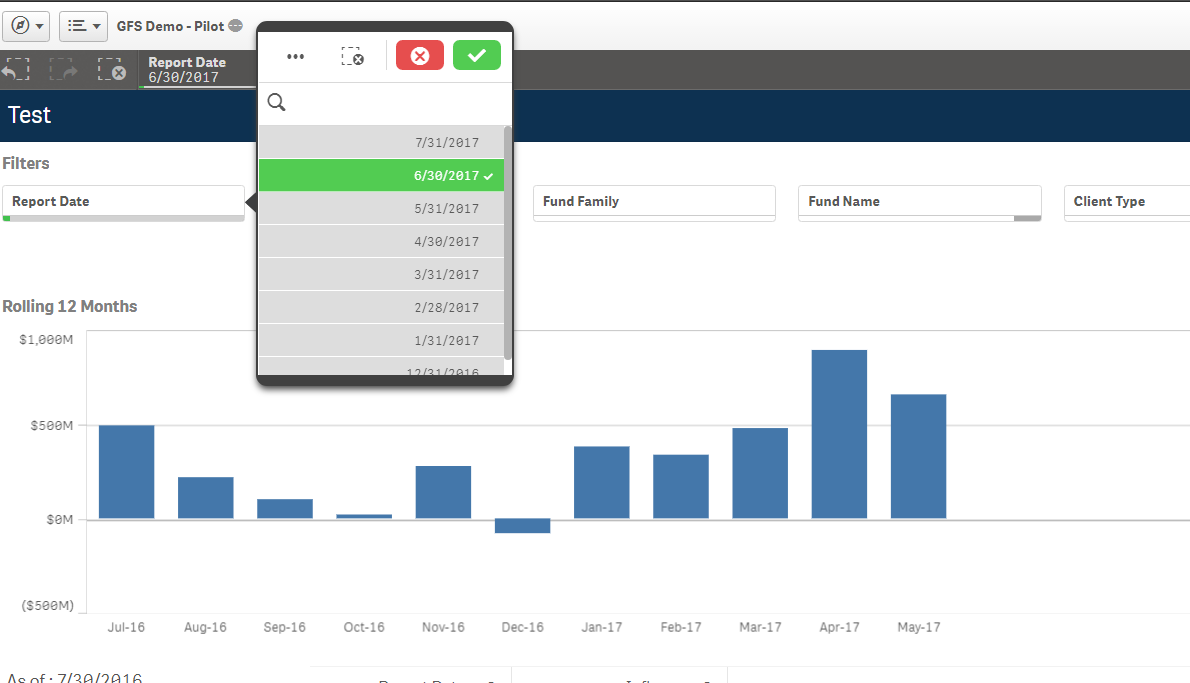
Without Selection:
Rolling_12M_Qlik.png
With selection on May 17
Rolling_12M_Qlik_Error.png
- « Previous Replies
-
- 1
- 2
- Next Replies »
Accepted Solutions
- Mark as New
- Bookmark
- Subscribe
- Mute
- Subscribe to RSS Feed
- Permalink
- Report Inappropriate Content
This here gives a timestamp like this 08/31/2017 11:59:59 pm. So, although you did use Floor, but MonthEnd changed the date back to timestamp
MonthEnd(Date(Floor("Transaction Date"))) as "Report Date"
On the other hand, this will give you 08/31/2017 00:00:00 am. So, first you find the Monthend (timestamp) and floored and use the date function for formatting.
Date(Floor(MonthEnd("Transaction Date"))) as "Report Date"
When you used the 1st one in set analysis, there are some rounding issues which might have caused you to not see the max month.... but when you used the new definition, no more rounding problems as we got rid of the time portion of the timestamp 
- Mark as New
- Bookmark
- Subscribe
- Mute
- Subscribe to RSS Feed
- Permalink
- Report Inappropriate Content
could you post a sample please.
- Mark as New
- Bookmark
- Subscribe
- Mute
- Subscribe to RSS Feed
- Permalink
- Report Inappropriate Content
Do you want the chart to reflect the user selection, or do you want a Rolling 12 Months that ignores what the user selects?
- Mark as New
- Bookmark
- Subscribe
- Mute
- Subscribe to RSS Feed
- Permalink
- Report Inappropriate Content
Yes. I want the chart to reflect the user selection.
- Mark as New
- Bookmark
- Subscribe
- Mute
- Subscribe to RSS Feed
- Permalink
- Report Inappropriate Content
I am posting the Sample Data below
| Report Date | Netflows |
| 7/1/2014 | 50000 |
| 8/1/2014 | 20000 |
| 9/1/2014 | 10000 |
| 10/1/2014 | 40000 |
| 11/1/2014 | 70000 |
| 12/1/2014 | 60000 |
| 1/1/2015 | 50000 |
| 2/1/2015 | 50000 |
| 3/1/2015 | 20000 |
| 4/1/2015 | 10000 |
| 5/1/2015 | 20000 |
| 6/1/2015 | 10000 |
| 7/1/2015 | 40000 |
| 8/1/2015 | 70000 |
| 9/1/2015 | 60000 |
| 10/1/2015 | 50000 |
| 11/1/2015 | 50000 |
| 12/1/2015 | 20000 |
| 1/1/2016 | 10000 |
| 2/1/2016 | 40000 |
| 3/1/2016 | 70000 |
| 4/1/2016 | 60000 |
| 5/1/2016 | 50000 |
| 6/1/2016 | 50000 |
| 7/1/2016 | 20000 |
| 8/1/2016 | 10000 |
| 9/1/2016 | 40000 |
| 10/1/2016 | 70000 |
| 11/1/2016 | 60000 |
| 12/1/2016 | 50000 |
| 1/1/2017 | 50000 |
| 2/1/2017 | 20000 |
| 3/1/2017 | 10000 |
| 4/1/2017 | 40000 |
| 5/1/2017 | 70000 |
| 6/1/2017 | 60000 |
| 7/1/2017 | 50000 |
| 8/1/2017 | 50000 |
- Mark as New
- Bookmark
- Subscribe
- Mute
- Subscribe to RSS Feed
- Permalink
- Report Inappropriate Content
Which field are you making selection in?
- Mark as New
- Bookmark
- Subscribe
- Mute
- Subscribe to RSS Feed
- Permalink
- Report Inappropriate Content
There is a Filter for Report Date on the Page.
user would want to select that, and the Rolling bar Chart should display the data accordingly.
i.e. for May 17 - It should show June 16 - May 17
- Mark as New
- Bookmark
- Subscribe
- Mute
- Subscribe to RSS Feed
- Permalink
- Report Inappropriate Content
Report Date is basically has the below data.
| Report Date |
| 7/1/2014 |
| 8/1/2014 |
| 9/1/2014 |
| 10/1/2014 |
| 11/1/2014 |
| 12/1/2014 |
| 1/1/2015 |
| 2/1/2015 |
| 3/1/2015 |
| 4/1/2015 |
| 5/1/2015 |
| 6/1/2015 |
| 7/1/2015 |
| 8/1/2015 |
| 9/1/2015 |
| 10/1/2015 |
| 11/1/2015 |
| 12/1/2015 |
| 1/1/2016 |
| 2/1/2016 |
| 3/1/2016 |
| 4/1/2016 |
| 5/1/2016 |
| 6/1/2016 |
| 7/1/2016 |
| 8/1/2016 |
| 9/1/2016 |
| 10/1/2016 |
| 11/1/2016 |
| 12/1/2016 |
| 1/1/2017 |
| 2/1/2017 |
| 3/1/2017 |
| 4/1/2017 |
| 5/1/2017 |
| 6/1/2017 |
| 7/1/2017 |
| 8/1/2017 |
- Mark as New
- Bookmark
- Subscribe
- Mute
- Subscribe to RSS Feed
- Permalink
- Report Inappropriate Content
I think you forgot to add an equal sign... try this
Sum(
{<
[Report Year]=,
[Report Month]=,
[Report Date]={'>=$(=MonthStart(Max([Report Date]),-11))<=$(=Date(Max([Report Date])))'}
>}
NetFlows)/1000000
- Mark as New
- Bookmark
- Subscribe
- Mute
- Subscribe to RSS Feed
- Permalink
- Report Inappropriate Content
I tried that too.
But it display's the data only till June'17 in default selection, though the data is available for Max Report Date as July.
And any selection on report date shows for a month less.
- « Previous Replies
-
- 1
- 2
- Next Replies »