Unlock a world of possibilities! Login now and discover the exclusive benefits awaiting you.
- Qlik Community
- :
- Forums
- :
- Analytics
- :
- New to Qlik Analytics
- :
- 2 date columns, count on hour
- Subscribe to RSS Feed
- Mark Topic as New
- Mark Topic as Read
- Float this Topic for Current User
- Bookmark
- Subscribe
- Mute
- Printer Friendly Page
- Mark as New
- Bookmark
- Subscribe
- Mute
- Subscribe to RSS Feed
- Permalink
- Report Inappropriate Content
2 date columns, count on hour
I have 2 date columns and need to count using their hour for each, but in the same graph.
For example:
col
| Arrive Date | Leave Date |
|---|---|
| 12/07/2018 07:00 | 12/07/2018 08:00 |
| 12/07/2018 08:00 | 12/07/2018 09:00 |
I need to count both columns using their hour.
So i want to end up with:
| For Arrive | For Leave |
|---|---|
| hour 7 = 1 | Hour 7 = 1 |
| hour 8 = 1 | Hour 8 = 1 |
| Hour 9 = 0 | Hour 9 = 1 |
When i try to use =hour(arrivedate) in the dimensions
then add two measures thus:
count(hour(arrivedate)
count(hour(LeaveDate)
it doesn't work.
How can i make this work??
Accepted Solutions
- Mark as New
- Bookmark
- Subscribe
- Mute
- Subscribe to RSS Feed
- Permalink
- Report Inappropriate Content
sorry, I was inattentive, I read it again, and understand the problem 
I think your data should arrange in other way:
DateTime | Type
2018-01-01 12:00 | Arrival
2018-01-01 21:00 | Leave
and the hour(DateTime) will be the common dimension, the measure can be count(*) and add dimension Type, to get two line/bar.
G.
- Mark as New
- Bookmark
- Subscribe
- Mute
- Subscribe to RSS Feed
- Permalink
- Report Inappropriate Content
Hi David,
try this:
=interval(LeaveDate-ArriveDate','h')
compact example:
=interval('2018-01-01 13:00'-'2018-01-01 01:00','h') ->gives you 12.
G.
- Mark as New
- Bookmark
- Subscribe
- Mute
- Subscribe to RSS Feed
- Permalink
- Report Inappropriate Content
Hi,
So I would use #Timestamp() for your Date-Time field to get that interpreted and then wrap that with Hour() to get an hour column and then you can count that?
Somethign like this:
Temp_Data:
LOAD * Inline [
Number, ArriveDate, LeaveDate
1, 12/07/2018 07:00, 12/07/2018 08:00
2, 12/07/2018 08:00, 12/07/2018 09:00
];
Data:
NoConcateNate
LOAD
Number,
TimeStamp#(ArriveDate,'MM/DD/YYYY HH:mm') As ArriveDate,
Hour(TimeStamp#(ArriveDate,'MM/DD/YYYY HH:mm')) As ArriveHour,
TimeStamp#(LeaveDate,'MM/DD/YYYY HH:mm') As LeaveDate,
Hour(TimeStamp#(LeaveDate,'MM/DD/YYYY HH:mm')) As LeaveHour
Resident Temp_Data;
Drop Table Temp_Data;
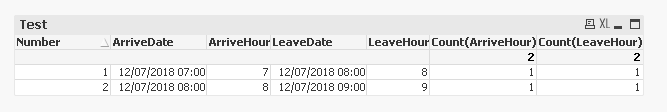
Best,
Ali A
- Mark as New
- Bookmark
- Subscribe
- Mute
- Subscribe to RSS Feed
- Permalink
- Report Inappropriate Content
Thanks but I'm not interested in the interval, I'm interested in counting how many dates fall in each hour of the day.so of I have 3 dates around 9:00 that would be a count of 3. If I have 2 dates around 1400, that is a count of 2 and so on...
I need a count like this for each column, shown in a graph. Base on one column is easy, because I can key on the dates from that column, but when it comes to including the other column, graphed into another bar on the same graph, I'm finding very difficult.
- Mark as New
- Bookmark
- Subscribe
- Mute
- Subscribe to RSS Feed
- Permalink
- Report Inappropriate Content
sorry, I was inattentive, I read it again, and understand the problem
I think your data should arrange in other way:
DateTime | Type
2018-01-01 12:00 | Arrival
2018-01-01 21:00 | Leave
and the hour(DateTime) will be the common dimension, the measure can be count(*) and add dimension Type, to get two line/bar.
G.
- Mark as New
- Bookmark
- Subscribe
- Mute
- Subscribe to RSS Feed
- Permalink
- Report Inappropriate Content
Damn it. I should've seen that. I've un-pvioted it in SQL and it works great now. Then i used set analysis for each BAR to produce the values i was after:
- =count({$<adStatus={"ADM_DTM"}>}adStatus)
- =count({$<adStatus={"DIS_DTM"}>}adStatus)
Thanks