Unlock a world of possibilities! Login now and discover the exclusive benefits awaiting you.
- Qlik Community
- :
- Forums
- :
- Analytics
- :
- New to Qlik Analytics
- :
- 3 graphs in one bar graph
- Subscribe to RSS Feed
- Mark Topic as New
- Mark Topic as Read
- Float this Topic for Current User
- Bookmark
- Subscribe
- Mute
- Printer Friendly Page
- Mark as New
- Bookmark
- Subscribe
- Mute
- Subscribe to RSS Feed
- Permalink
- Report Inappropriate Content
3 graphs in one bar graph
Hi all,
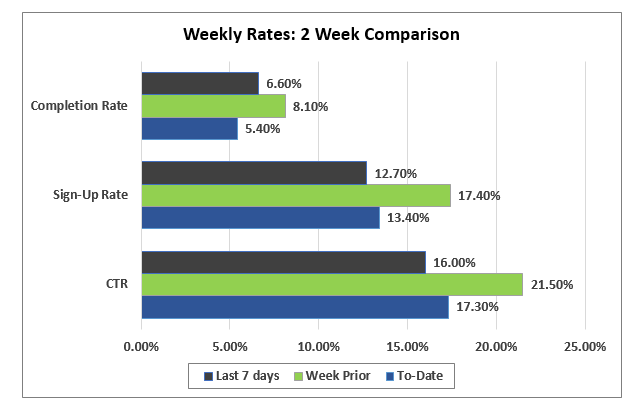
I have 3 different bar charts like in image below i need to show up in single chart.
How can i do this.
For reference i am attaching the .qvf file. In that it has only single bar and two bar charts, As it is sample data i don't have other two bars and one more chart.
Regards,
Pramod
- Mark as New
- Bookmark
- Subscribe
- Mute
- Subscribe to RSS Feed
- Permalink
- Report Inappropriate Content
A single graph but with set analysis defining the time frame should works.
Eva
- Mark as New
- Bookmark
- Subscribe
- Mute
- Subscribe to RSS Feed
- Permalink
- Report Inappropriate Content
You can look at this extension
http://branch.qlik.com/projects/showthread.php?389-D3-Visualization-Library
One of his chart is the option you need
- Mark as New
- Bookmark
- Subscribe
- Mute
- Subscribe to RSS Feed
- Permalink
- Report Inappropriate Content
HI robert,
Thanks for the reply.
Is it possibe to add following measure as dimension?
Sum({$<CanonicalDate = {">=$(=max(date(CanonicalDate)-7))<=$(=max(date(CanonicalDate)))"},client_id = {15}>}[course_completed])
/
Count({$<CanonicalDate = {">=$(=max(date(CanonicalDate)-7))<=$(=max(date(CanonicalDate)))"},client_id = {15}>}[invitation_id])
- Mark as New
- Bookmark
- Subscribe
- Mute
- Subscribe to RSS Feed
- Permalink
- Report Inappropriate Content
You can dimensionalize most measure expressions by using the aggr() function
Aggr( <YourMeasureExpression> , Dimension1, Dimension2, etc...)
...where Dimension1 etc... determines the level of aggregation which you need to be explicit about.
Also - there is probably a data model solution to this question as well. You can create a resident load to create a new table that leverages qlik's row level association to buckets dates into the 1 or more of the 3 date ranges. Then there is less calculation in the UI. Could be an option if you run into slowness in chart rendering.
- Mark as New
- Bookmark
- Subscribe
- Mute
- Subscribe to RSS Feed
- Permalink
- Report Inappropriate Content
Hi Jonathan,
Thanks for the reply.
Could you please help me with my sample data.
I am not getting. If possible both the scenario.
The problem is my dimension will become the measure.
For Ex: Below expression will give the count of sign ups.
This i need to use to display last 7days, week prior, and program To-date.
Count({$<DateType = {signed}>}user_signed).
Thanks,
Pramod
- Mark as New
- Bookmark
- Subscribe
- Mute
- Subscribe to RSS Feed
- Permalink
- Report Inappropriate Content
Anyone help on this.