Unlock a world of possibilities! Login now and discover the exclusive benefits awaiting you.
- Qlik Community
- :
- Forums
- :
- Analytics
- :
- New to Qlik Analytics
- :
- Adding customized color to lines in Line graph
- Subscribe to RSS Feed
- Mark Topic as New
- Mark Topic as Read
- Float this Topic for Current User
- Bookmark
- Subscribe
- Mute
- Printer Friendly Page
- Mark as New
- Bookmark
- Subscribe
- Mute
- Subscribe to RSS Feed
- Permalink
- Report Inappropriate Content
Adding customized color to lines in Line graph
Hi,
I have a graph with
Dimension: Month
Expresion : count({<DateType = {invitation} >}invitation_id)
count({<DateType = {completion} >}completion)
count({<DateType = {accesed} >}accesed)
Its taking default colors, i need to add my own colors/add customized color. How to do this?
You can find the Qvf file attached below
Please help me.
Regards
- Tags:
- line-color
- « Previous Replies
-
- 1
- 2
- Next Replies »
- Mark as New
- Bookmark
- Subscribe
- Mute
- Subscribe to RSS Feed
- Permalink
- Report Inappropriate Content
try
if(count({<DateType = {invitation} >}invitation_id),Red(),
if(count({<DateType = {completion} >}completion),green(),
if( count({<DateType = {accesed} >}accesed),yellow(),blue())))
- Mark as New
- Bookmark
- Subscribe
- Mute
- Subscribe to RSS Feed
- Permalink
- Report Inappropriate Content
See this image:

- Mark as New
- Bookmark
- Subscribe
- Mute
- Subscribe to RSS Feed
- Permalink
- Report Inappropriate Content
Thanks,
I have three expression, you have suggested to use one expression. Should i replace given expression in all three expression of my or where should i put this?
- Mark as New
- Bookmark
- Subscribe
- Mute
- Subscribe to RSS Feed
- Permalink
- Report Inappropriate Content
Thnaks for reply,
Your condition Put color based on value of y axis in if condition.
But my Counts differs everyday and counts are dynamic.So
Line color of Invitation,completion and accessed should be static irrespect of counts.
- Mark as New
- Bookmark
- Subscribe
- Mute
- Subscribe to RSS Feed
- Permalink
- Report Inappropriate Content
You can assign colour for each dimension or expression, and you can write a complete expression to select the colour result in this expressions
- Mark as New
- Bookmark
- Subscribe
- Mute
- Subscribe to RSS Feed
- Permalink
- Report Inappropriate Content
If you upload an example with your data, can explain better
- Mark as New
- Bookmark
- Subscribe
- Mute
- Subscribe to RSS Feed
- Permalink
- Report Inappropriate Content
Hi,
Please Check attached Qvf file
- Mark as New
- Bookmark
- Subscribe
- Mute
- Subscribe to RSS Feed
- Permalink
- Report Inappropriate Content
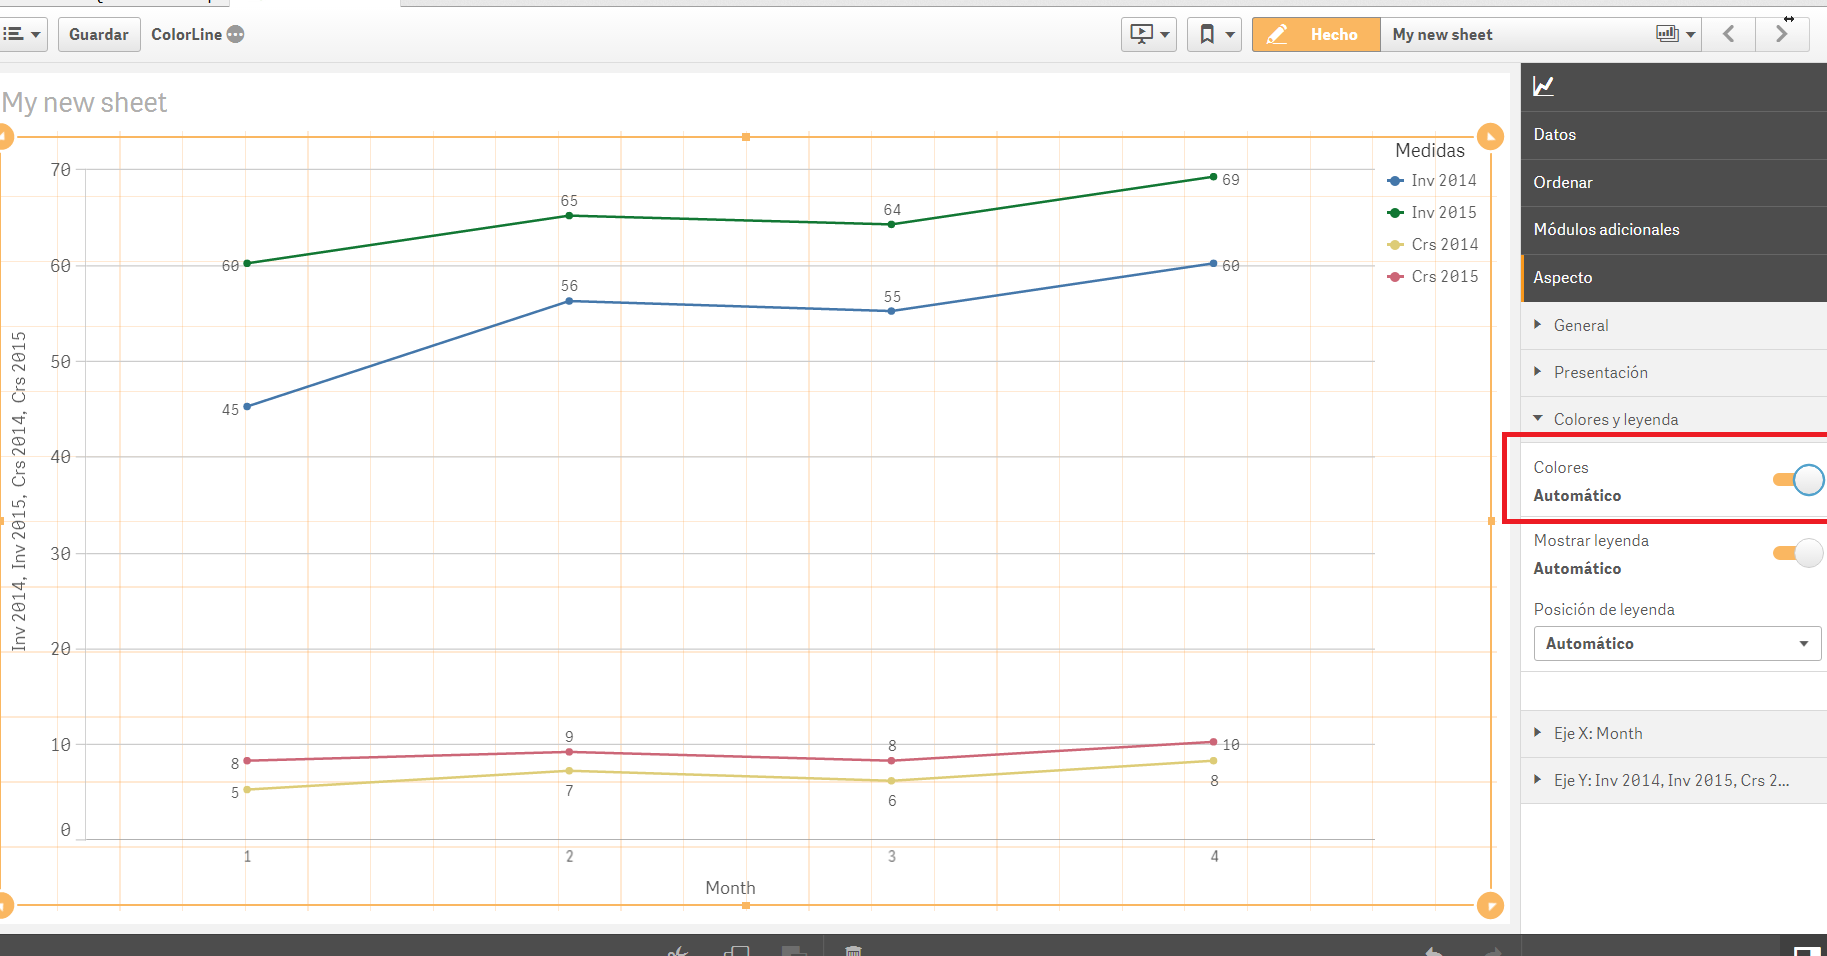
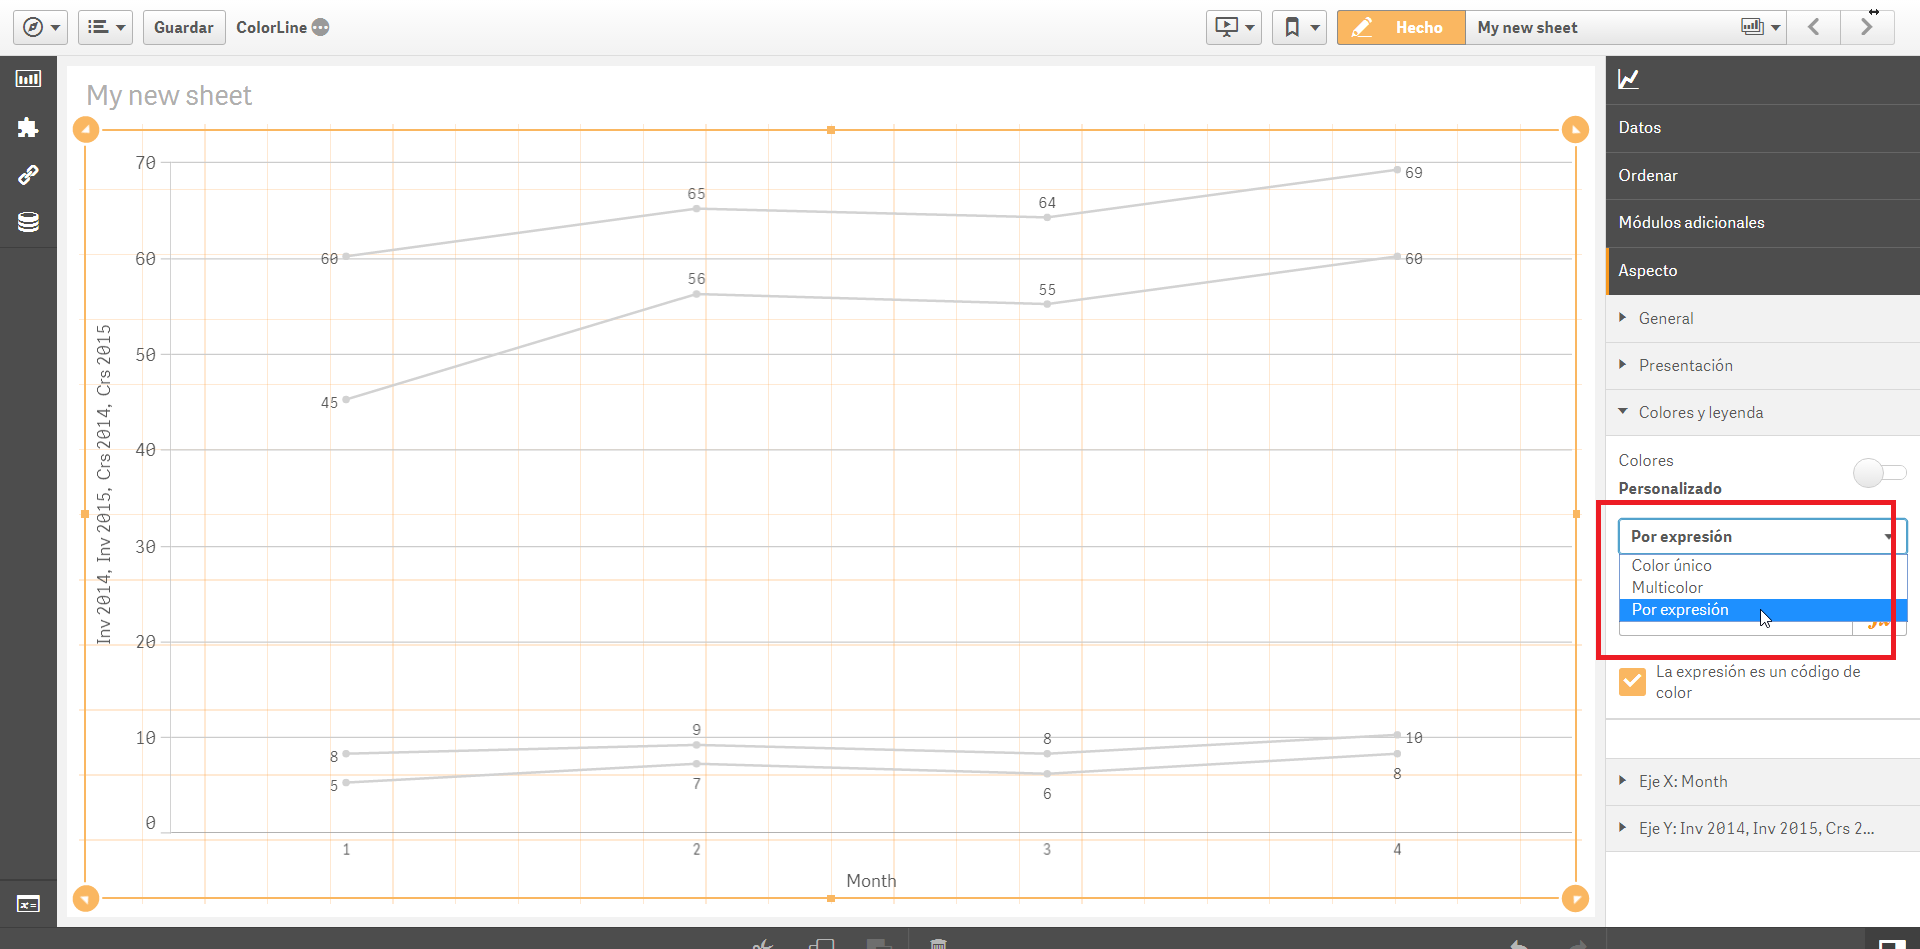
See this images (I'm sorry because my QV & QS are in Spanish version)
- Mark as New
- Bookmark
- Subscribe
- Mute
- Subscribe to RSS Feed
- Permalink
- Report Inappropriate Content
Hi,
Is this below expression i should give in By expression box
if(Sum({<Year={2014}>} Inv),Red(),
if(Sum({<Year={2015}>} Inv),green(),
if( Sum({<Year={2014}>} Crs),yellow(),blue())))
If i give like this Every line will be blue.
- « Previous Replies
-
- 1
- 2
- Next Replies »