Unlock a world of possibilities! Login now and discover the exclusive benefits awaiting you.
- Qlik Community
- :
- Forums
- :
- Analytics
- :
- New to Qlik Analytics
- :
- Aggr Expressions NOT Working when using ValueList(...
- Subscribe to RSS Feed
- Mark Topic as New
- Mark Topic as Read
- Float this Topic for Current User
- Bookmark
- Subscribe
- Mute
- Printer Friendly Page
- Mark as New
- Bookmark
- Subscribe
- Mute
- Subscribe to RSS Feed
- Permalink
- Report Inappropriate Content
Aggr Expressions NOT Working when using ValueList() to create Synthetic Dimension
I have attached a sample Qlik Sense App that contains a straight table with Custom Dimensions and Expressions.
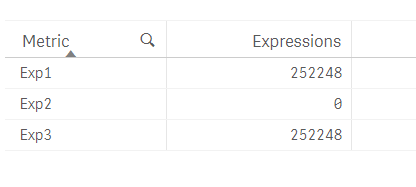
Here you would see that the second expression DOES NOT generate any output, even though it is the same expression. The only thing that stands out to me is that, the second instance of AGGR in such scenario doesn't work.
Front End Table

Table Expression Code
Dimension:
=ValueList('Exp1', 'Exp2', 'Exp3')
Expression:
Pick(Match(ValueList('Exp1', 'Exp2', 'Exp3'), 'Exp1', 'Exp2', 'Exp3')
, Sum(Aggr(Sum(Expression1), Dim1))
, Sum(Aggr(Sum(Expression1), Dim1))
, Sum(Expression1)
)
Any help is appreciated.
Accepted Solutions
- Mark as New
- Bookmark
- Subscribe
- Mute
- Subscribe to RSS Feed
- Permalink
- Report Inappropriate Content
Here is the solution that worked for me:
Create island tables with the Dummy Dimensions in the Data Model (instead of using ValueList() function to create the synthetic dimensions) and include the Dimension Field in grouping.
Dimension
KPI_Dimension:
Load * INLINE [
KPI_Metric
Exp1
Exp2
Exp3
];
Expression:
Pick(Match(ValueList('Exp1', 'Exp2', 'Exp3'), 'Exp1', 'Exp2', 'Exp3')
, Sum(Aggr(Sum(Expression1), Dim1, KPI_Metric))
, Sum(Aggr(Sum(Expression1), Dim1, KPI_Metric))
, Sum(Expression1)
)
This solves the problem of creating unique aggregations, which is not possible using ValueList(), where the Qlik Engine doesn't understand each dummy value needs a distinct grouping.
- Mark as New
- Bookmark
- Subscribe
- Mute
- Subscribe to RSS Feed
- Permalink
- Report Inappropriate Content
Try
Pick(Match(ValueList('Exp1', 'Exp2', 'Exp3'), 'Exp1', 'Exp2', 'Exp3')
, Sum(TOTAL Aggr( Sum(Expression1), Dim1))
//, Sum(Aggr(Sum(Expression1), Dim1))
, Sum(TOTAL Aggr( Sum(Expression1), Dim1))
, Sum(Expression1)
)
- Mark as New
- Bookmark
- Subscribe
- Mute
- Subscribe to RSS Feed
- Permalink
- Report Inappropriate Content
This is a known issue... look here:
Q-Tip # 14 – AGGR() and Synthetic Dimensions | Natural Synergies
- Mark as New
- Bookmark
- Subscribe
- Mute
- Subscribe to RSS Feed
- Permalink
- Report Inappropriate Content
Here is the solution that worked for me:
Create island tables with the Dummy Dimensions in the Data Model (instead of using ValueList() function to create the synthetic dimensions) and include the Dimension Field in grouping.
Dimension
KPI_Dimension:
Load * INLINE [
KPI_Metric
Exp1
Exp2
Exp3
];
Expression:
Pick(Match(ValueList('Exp1', 'Exp2', 'Exp3'), 'Exp1', 'Exp2', 'Exp3')
, Sum(Aggr(Sum(Expression1), Dim1, KPI_Metric))
, Sum(Aggr(Sum(Expression1), Dim1, KPI_Metric))
, Sum(Expression1)
)
This solves the problem of creating unique aggregations, which is not possible using ValueList(), where the Qlik Engine doesn't understand each dummy value needs a distinct grouping.
- Mark as New
- Bookmark
- Subscribe
- Mute
- Subscribe to RSS Feed
- Permalink
- Report Inappropriate Content
Any idea how to get this set analysis right
the first line works the others are zero
PICK( Match(ORDEM1,
$(=Concat({<ORDEM1 -= {''}>}DISTINCT chr(39) & ORDEM1 & chr(39),',',ORDEM1))
),
sum({<Ano={$(=Max(Ano))},[Mes]={'Fev'}>}Aggr($(vExpressao1), Ano,Mes)),sum({<Ano={$(=Max(Ano))},[Mes]={'Fev'}>}Aggr($(vExpressao2), Ano,Mes)),
sum({<Ano={$(=Max(Ano))},[Mes]={'Fev'}>}Aggr($(vExpressao3), Ano,Mes)),sum({<Ano={$(=Max(Ano))},[Mes]={'Fev'}>}Aggr($(vExpressao4), Ano,Mes))
)
- Mark as New
- Bookmark
- Subscribe
- Mute
- Subscribe to RSS Feed
- Permalink
- Report Inappropriate Content
Sunny,
the first line works the others are zero
- Mark as New
- Bookmark
- Subscribe
- Mute
- Subscribe to RSS Feed
- Permalink
- Report Inappropriate Content
Hi,
What should come in Expression1?
And where should we define it? Data load or write it as expression?
Dimension
KPI_Dimension:
Load * INLINE [
KPI_Metric
GMV
Discounts
Cancellation
Return
NetSales
];
My GMV Expression : (Sum(Aggr(Only(line_items_price), [order_id]))).
Not sure how to include this in
Pick(Match(ValueList('Exp1', 'Exp2', 'Exp3'), 'Exp1', 'Exp2', 'Exp3')
, Sum(Aggr(Sum(Expression1), Dim1, KPI_Metric))
, Sum(Aggr(Sum(Expression1), Dim1, KPI_Metric))
, Sum(Expression1)
)
to make it work.
