Unlock a world of possibilities! Login now and discover the exclusive benefits awaiting you.
- Qlik Community
- :
- Forums
- :
- Analytics
- :
- New to Qlik Analytics
- :
- 【Aggr】How to select items which have changed more ...
- Subscribe to RSS Feed
- Mark Topic as New
- Mark Topic as Read
- Float this Topic for Current User
- Bookmark
- Subscribe
- Mute
- Printer Friendly Page
- Mark as New
- Bookmark
- Subscribe
- Mute
- Subscribe to RSS Feed
- Permalink
- Report Inappropriate Content
【Aggr】How to select items which have changed more than one time?
Dear Qlik Sense Experts
I am new to Qlik Sense Desktop and I have a complicated front end question as below
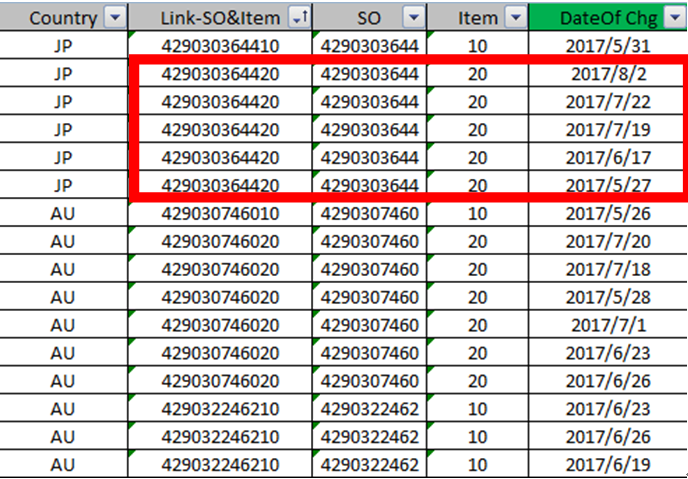
The raw data shows that how many times an order change
- Each order has different items and each item may change several times, thus I use [Link-SO&Item] to mark it as an unique ID
- [DateOf Chg] shows the date that [Link-SO&Item] changes. One unique ID only changes once per day. Take 429030364420 as an example, it changes 5 times at different dates
My app is as below
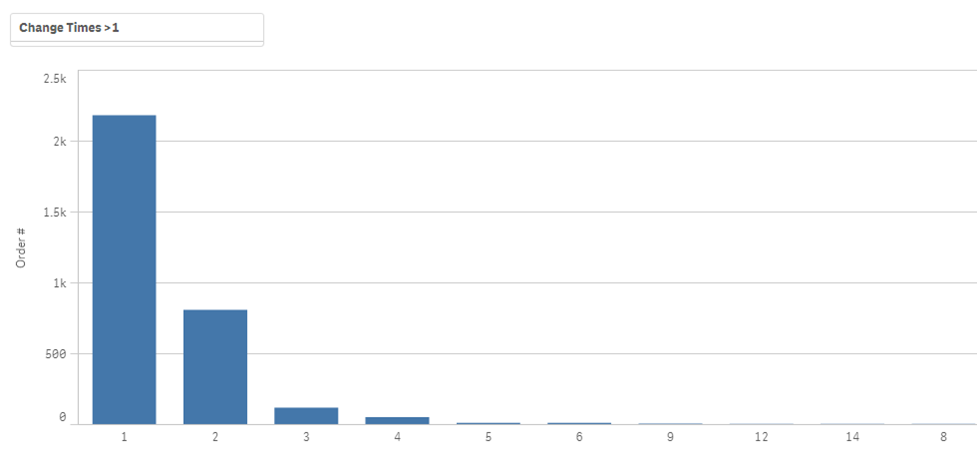
- X-axis is a drill down dimension.
=aggr (Count([DateOf Chg]), [Link-SO&Item])
=> This is to count how many [DateOf Chg] of each [Link-SO&Item] has.
=Country
- Y-axis shows you how many [Link-SO&Item] we have under the change times
=> Count(distinct [Link-SO&Item])
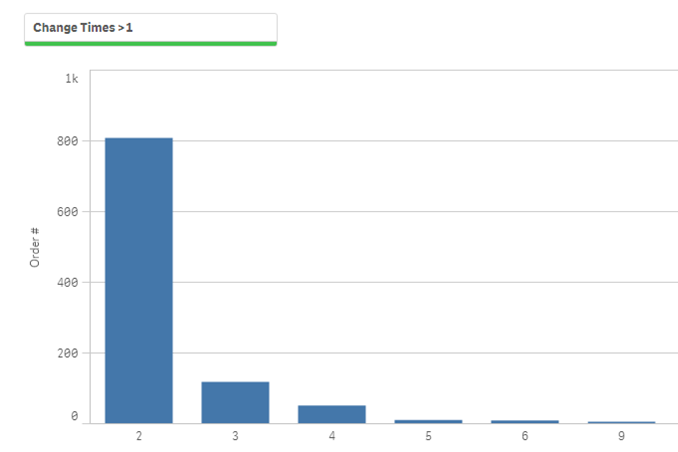
- I add a critical filter in dimension that I only need [Link-SO&Item] that the [DateOf Chg] is more than '1' (I am not sure if my expression is correct). I have to click 'y' on it before I do anaylze to exlude '1'
=Aggr(if(Count({<[Link-SO&Item]={'=Count([DateOf Chg])>1'}>}[DateOf Chg])>1,'y','n'), [Link-SO&Item])
My Question is as below
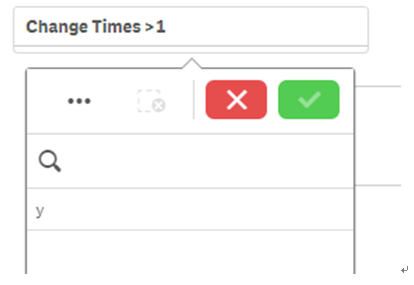
1.There should be ‘y’ and ‘n’ in the filter but only ‘y’ stands there, why?
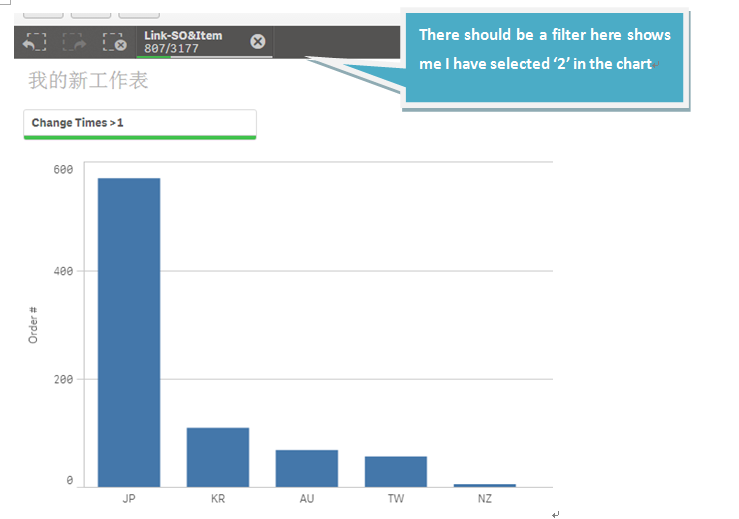
2. When I click the number on the chart (e.g. ‘2’), there should be a filter to show me I have selected ‘2’ so that I can easily change to other number I need in the 1st layout. But there isn’t any. How can I make it happen
You can check the raw data and qvf file in the attachment for your reference
Thank you for your advice in advance
Ivan
Accepted Solutions
- Mark as New
- Bookmark
- Subscribe
- Mute
- Subscribe to RSS Feed
- Permalink
- Report Inappropriate Content
For the first requirement, change your filter pane's expression to this
=Aggr(if(Count([DateOf Chg])>1,'y','n'), [Link-SO&Item])
Not sure how to get the 2nd req working
- Mark as New
- Bookmark
- Subscribe
- Mute
- Subscribe to RSS Feed
- Permalink
- Report Inappropriate Content
For the first requirement, change your filter pane's expression to this
=Aggr(if(Count([DateOf Chg])>1,'y','n'), [Link-SO&Item])
Not sure how to get the 2nd req working
- Mark as New
- Bookmark
- Subscribe
- Mute
- Subscribe to RSS Feed
- Permalink
- Report Inappropriate Content
Sunny
Sorry for the late reply.
Your expression works, thank you so much
For question 2, seems the selection can't display on top bar if we set expression in master item (dimension)
Lets say if I set 'Today()-Order Date' in master item (dimension), the result is same that nothing shows up in top bar after I select data in this new dimension
Ivan