Unlock a world of possibilities! Login now and discover the exclusive benefits awaiting you.
- Qlik Community
- :
- Forums
- :
- Analytics
- :
- New to Qlik Analytics
- :
- Arranging as per values
- Subscribe to RSS Feed
- Mark Topic as New
- Mark Topic as Read
- Float this Topic for Current User
- Bookmark
- Subscribe
- Mute
- Printer Friendly Page
- Mark as New
- Bookmark
- Subscribe
- Mute
- Subscribe to RSS Feed
- Permalink
- Report Inappropriate Content
Arranging as per values
Hello Qlik Experts,
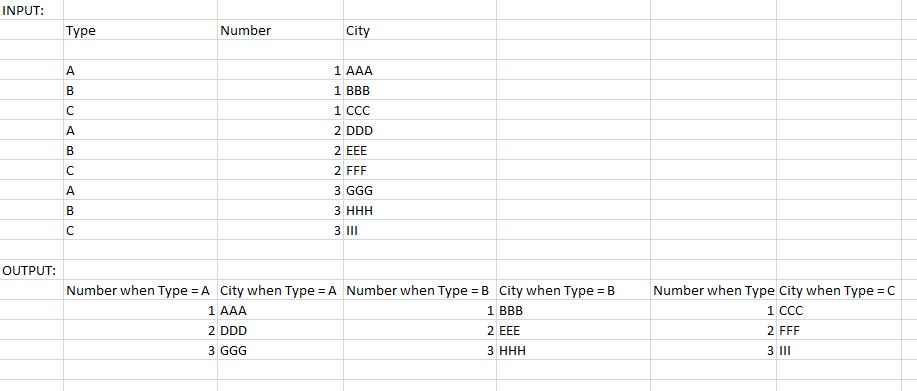
I require an output as displayed above. I want to display the data in different columns as shown.
I have used IF clause but it only displays only one section at a time and the other 2 sections appear blank.
I want all the sections to appear in a single row without any blank values.
Thanks in Advance.
Accepted Solutions
- Mark as New
- Bookmark
- Subscribe
- Mute
- Subscribe to RSS Feed
- Permalink
- Report Inappropriate Content
Xyz:
LOAD Type,
Number,
City
FROM
A1:
load Type as type1,
Number as Number1,
City as City1 Resident Xyz where Type = 'A' ;
A1:
load Type as type2,
Number as Number2,
City as City2 Resident Xyz where Type = 'B' ;
A1:
load Type as type3,
Number as Number3,
City as City3 Resident Xyz where Type = 'C' ;
EXIT SCRIPT ;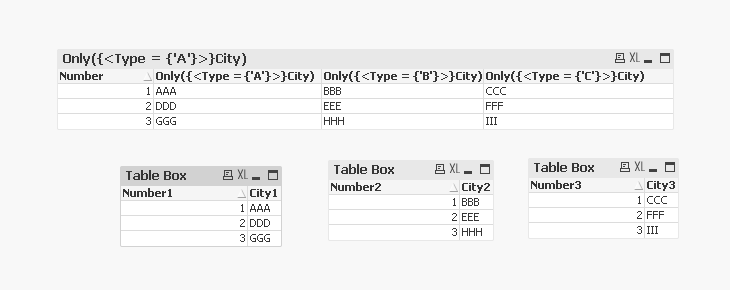
- Mark as New
- Bookmark
- Subscribe
- Mute
- Subscribe to RSS Feed
- Permalink
- Report Inappropriate Content
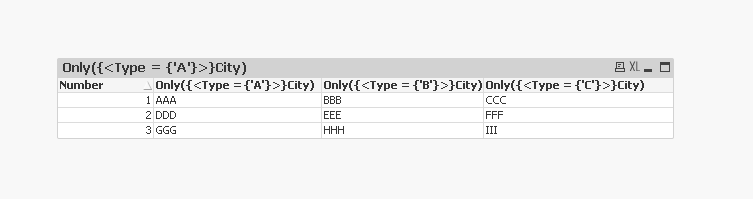
Try this :
- Mark as New
- Bookmark
- Subscribe
- Mute
- Subscribe to RSS Feed
- Permalink
- Report Inappropriate Content
Hey thanks a lot for your reply.
This works perfectly in the front end.
However I have a lot of fields, so is it possible to write this in the Script (Back end).
If Yes, could you please tell me the code.
- Mark as New
- Bookmark
- Subscribe
- Mute
- Subscribe to RSS Feed
- Permalink
- Report Inappropriate Content
Xyz:
LOAD Type,
Number,
City
FROM
A1:
load Type as type1,
Number as Number1,
City as City1 Resident Xyz where Type = 'A' ;
A1:
load Type as type2,
Number as Number2,
City as City2 Resident Xyz where Type = 'B' ;
A1:
load Type as type3,
Number as Number3,
City as City3 Resident Xyz where Type = 'C' ;
EXIT SCRIPT ;
- Mark as New
- Bookmark
- Subscribe
- Mute
- Subscribe to RSS Feed
- Permalink
- Report Inappropriate Content
Thanks a lot..!!