Unlock a world of possibilities! Login now and discover the exclusive benefits awaiting you.
- Qlik Community
- :
- Forums
- :
- Analytics
- :
- New to Qlik Analytics
- :
- Average aggr with date drill down
- Subscribe to RSS Feed
- Mark Topic as New
- Mark Topic as Read
- Float this Topic for Current User
- Bookmark
- Subscribe
- Mute
- Printer Friendly Page
- Mark as New
- Bookmark
- Subscribe
- Mute
- Subscribe to RSS Feed
- Permalink
- Report Inappropriate Content
Average aggr with date drill down
Hi there,
I'm creating a nice little reference line on a chart showing the average of calls made, by date (month).
I want to add in a date drill down to this chart, but obviously, having hard coded the date dimension into the avg aggregate the reference line doesn't change.
Does anyone know of any way around this?
Thanks
Neil
- Mark as New
- Bookmark
- Subscribe
- Mute
- Subscribe to RSS Feed
- Permalink
- Report Inappropriate Content
Hi,
Try adding the date drill down group name itself instead of date dimension in the avg aggregate expression.
Thanks,
Hemanth.
- Mark as New
- Bookmark
- Subscribe
- Mute
- Subscribe to RSS Feed
- Permalink
- Report Inappropriate Content
=Avg(Aggr(COUNT(Distinct CallID),[$(=Getcurrentfield([My Group]))]))
Where My Group is the Drill Down Group Name
EDITED:
When you write above expression, you will get some red lines (syntax error).. Please ignore them.
- Mark as New
- Bookmark
- Subscribe
- Mute
- Subscribe to RSS Feed
- Permalink
- Report Inappropriate Content
Hi Hemantha,
Unfortunately QlikSense doesn't recognised the drill down group name in the expression
Neil
- Mark as New
- Bookmark
- Subscribe
- Mute
- Subscribe to RSS Feed
- Permalink
- Report Inappropriate Content
Hi Manish,
That would be lovely, but unfortunately getcurrentfield isn't supported by QlikSense (yet):
Sorry!
Neil
- Mark as New
- Bookmark
- Subscribe
- Mute
- Subscribe to RSS Feed
- Permalink
- Report Inappropriate Content
- Mark as New
- Bookmark
- Subscribe
- Mute
- Subscribe to RSS Feed
- Permalink
- Report Inappropriate Content
A master item has some limitations. For example you can reference the item in a conditional expression.
I took another approach but similar. Instead of a master item , how about a conditional dimension and a conditional measure ?
If i load Year, Month, and Date in a load script like this:
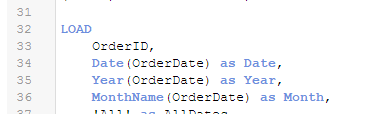
Then i can use a conditional dimension like this:
if( GetPossibleCount(Year)=0 or GetPossibleCount(Year)>1, Year,
if( GetPossibleCount(Month)=0 or GetPossibleCount(Month)>1, Month,Date(Date))
)
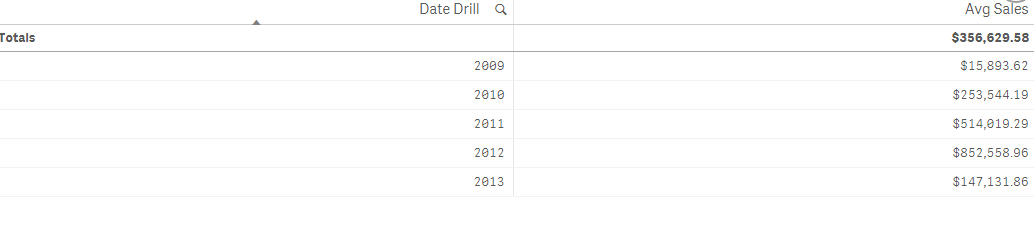
And a conditional measure (to calc avgs) like this:
if( GetPossibleCount(Year)=0 or GetPossibleCount(Year)>1,
avg( aggr(sum(Sales),Year)) ,
if( GetPossibleCount(Month)=0 or GetPossibleCount(Month)>1, avg( aggr(sum(Sales),Month)),avg( aggr(sum(Sales),Date)))
)
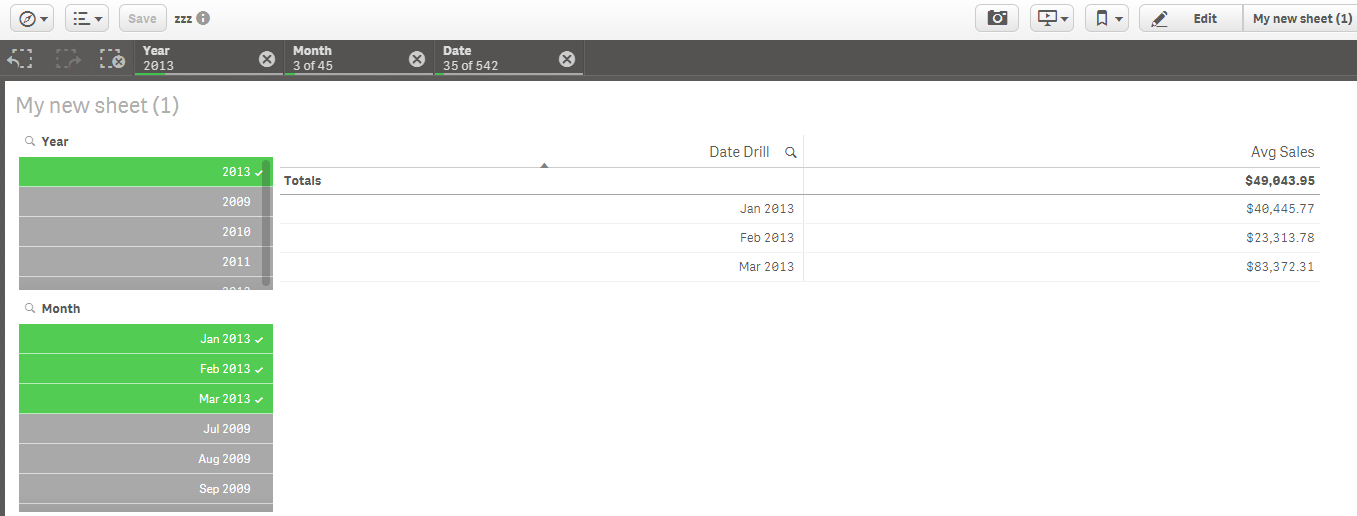
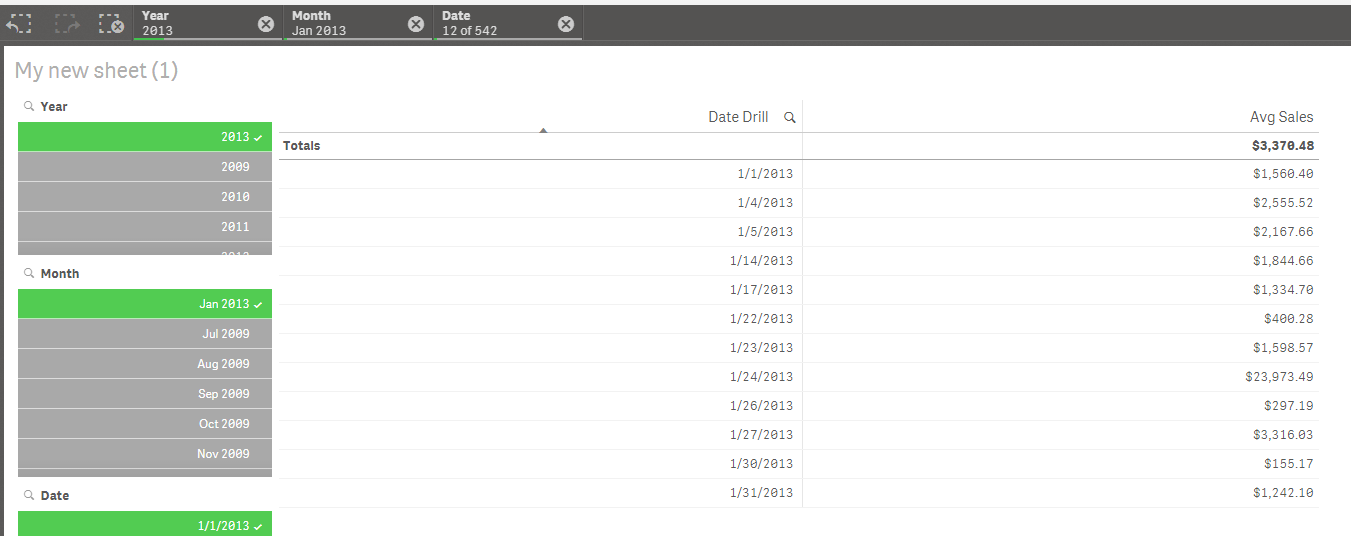
The 'drill' looks like this: