Unlock a world of possibilities! Login now and discover the exclusive benefits awaiting you.
- Qlik Community
- :
- Forums
- :
- Analytics
- :
- New to Qlik Analytics
- :
- Bar Chart with static X-axis in Qliksense
- Subscribe to RSS Feed
- Mark Topic as New
- Mark Topic as Read
- Float this Topic for Current User
- Bookmark
- Subscribe
- Mute
- Printer Friendly Page
- Mark as New
- Bookmark
- Subscribe
- Mute
- Subscribe to RSS Feed
- Permalink
- Report Inappropriate Content
Bar Chart with static X-axis in Qliksense
Hi All,
I am facing an issue in fixing the range of X-axis on bar chart so that all the values will be visible after making selection from filter pane whether is available or not for that particular dimension.
Please find the attached screenshot of Bar chart which filtered the records on the basis of selection I made from filter pane.
Could someone help me in fixing the x-axis on bar chart irrespective of selection we made.
- Mark as New
- Bookmark
- Subscribe
- Mute
- Subscribe to RSS Feed
- Permalink
- Report Inappropriate Content
Hi Nikita,
What you need to do is use set analysis to exclude the x-axis. Use this formula:
Sum({$< Timestamp = >}Colli)Now it won't change based on the time stamp, but will on all other selections.
Jordy
Climber
- Mark as New
- Bookmark
- Subscribe
- Mute
- Subscribe to RSS Feed
- Permalink
- Report Inappropriate Content
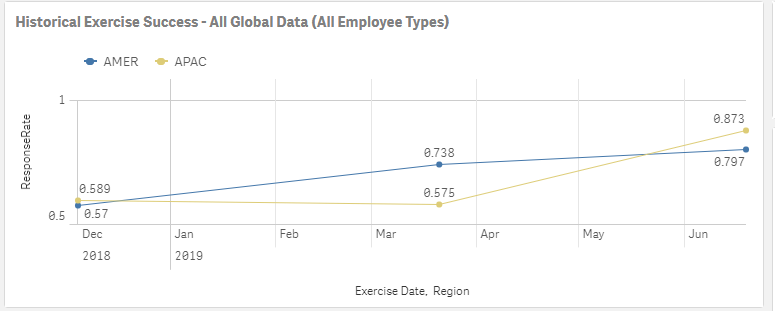
Can you add more than 1 column to exclude? I have the following..
Count({1<[Message Response]={'Responded'}>} [Message Response]) / (Count({1<[Message Response]={'Responded'}>} [Message Response])+ Count({1<[Message Response]={'No Response'}>} [Message Response]))
I want to exclude ALL field selections from modifying my chart. but when I make a selection in a field called "Region", the chart updates.
I added two images. one for the chart with no selections in the fields and the other with "AMER" selected in the Region field.