Unlock a world of possibilities! Login now and discover the exclusive benefits awaiting you.
- Qlik Community
- :
- Forums
- :
- Analytics
- :
- New to Qlik Analytics
- :
- Bar chart in Qliksense
- Subscribe to RSS Feed
- Mark Topic as New
- Mark Topic as Read
- Float this Topic for Current User
- Bookmark
- Subscribe
- Mute
- Printer Friendly Page
- Mark as New
- Bookmark
- Subscribe
- Mute
- Subscribe to RSS Feed
- Permalink
- Report Inappropriate Content
Bar chart in Qliksense
Hi all,
I would need help on the stacked bar chart in qliksense.
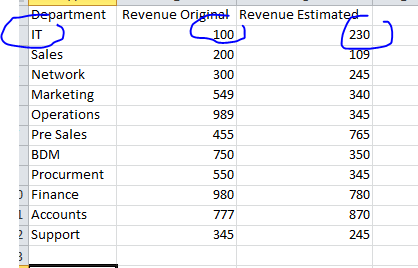
I have 3 columns of data i.e Department, Revenue Original, Revenue Estimated.
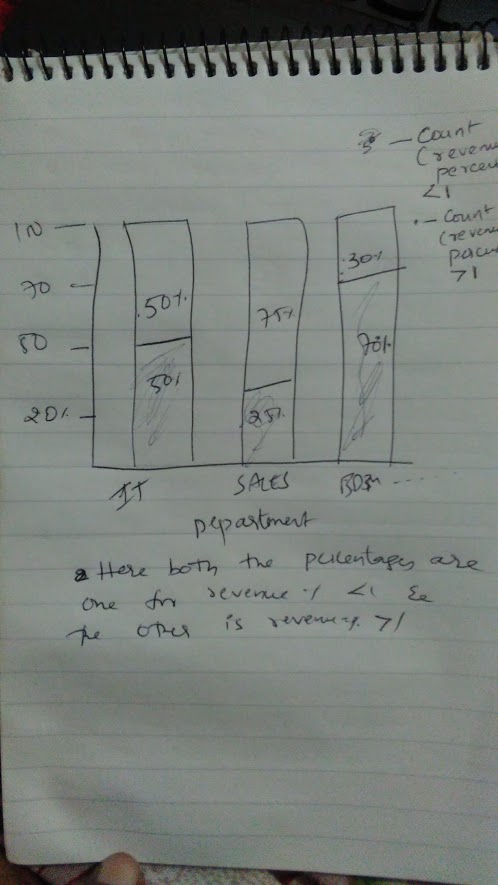
Now i have to calculate revenue ratio i.e revenue original / revenue estimated -
who calculate the percentage (revenue original/revenue estimate) / total of both sum and if the ratio is <1 make it revenue failure if not revenue failure.
and we need to count the number of revenue failure and revenue pass percentage.
those percentage graph should be on bar chart .
Ex is attached in the image and source spread sheet is also attached - please help me out
- « Previous Replies
-
- 1
- 2
- Next Replies »
- Mark as New
- Bookmark
- Subscribe
- Mute
- Subscribe to RSS Feed
- Permalink
- Report Inappropriate Content
What?
How don't want to take ur departement as a whole when u have only one line/information by department?
I really don't get it.........
Well, I helped u as possible; hope that was helpful...
- « Previous Replies
-
- 1
- 2
- Next Replies »