Unlock a world of possibilities! Login now and discover the exclusive benefits awaiting you.
- Qlik Community
- :
- Forums
- :
- Analytics
- :
- New to Qlik Analytics
- :
- Calculate Percentage of Multidimensional columns
- Subscribe to RSS Feed
- Mark Topic as New
- Mark Topic as Read
- Float this Topic for Current User
- Bookmark
- Subscribe
- Mute
- Printer Friendly Page
- Mark as New
- Bookmark
- Subscribe
- Mute
- Subscribe to RSS Feed
- Permalink
- Report Inappropriate Content
Calculate Percentage of Multidimensional columns
Hello Community,
I want to create a Percentages based on the range of Amount by Year and Company. Please find the details below. I tried a couple of approaches but I am not able to achieve the expected result.
Actual Table:
| Year | Company | Amount |
| 2010 | Apple | 10 |
| 2010 | Nokia | 20 |
| 2010 | Samsung | 30 |
| 2010 | Apple | 100 |
| 2010 | Nokia | 200 |
| 2010 | Apple | 500 |
| 2011 | Nokia | 100 |
| 2011 | Samsung | 200 |
| 2012 | Apple | 500 |
| 2012 | Nokia | 150 |
| 2014 | Apple | 600 |
| 2014 | Nokia | 100 |
| 2014 | Samsung | 150 |
| 2014 | Apple | 300 |
| 2014 | Nokia | 200 |
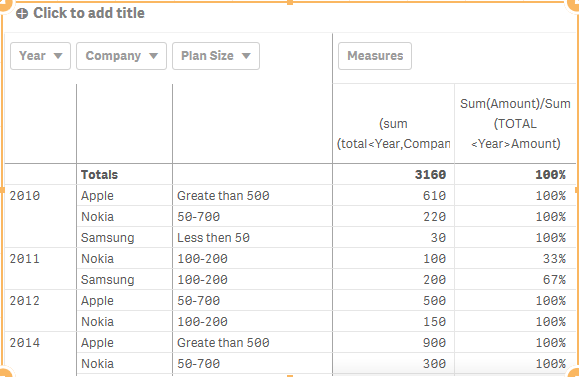
Result Table: This is giving me the percentages of all the years.
| Year | Company | Plan Size | Total Amount | Percentages |
| Totals | 3160 | 100% | ||
| 2010 | Apple | Greate than 500 | 610 | 19% |
| Nokia | 50-700 | 220 | 7% | |
| Samsung | Less then 50 | 30 | 1% | |
| 2011 | Nokia | 100-200 | 100 | 3% |
| Samsung | 100-200 | 200 | 6% | |
| 2012 | Apple | 50-700 | 500 | 16% |
| Nokia | 100-200 | 150 | 5% | |
| 2014 | Apple | Greate than 500 | 900 | 28% |
| Nokia | 50-700 | 300 | 9% | |
| Samsung | 100-200 | 150 | 5% |
Dimension Expression:
Plan Size:
if(aggr(sum(Amount),Year,Company)<50,'Less then 50',
if(aggr(sum(Amount),Year,Company)>=100 and aggr(sum(Amount),Year,Company)<=200 ,'100-200',
if(aggr(sum(Amount),Year,Company)>500,'Greate than 500',
if(aggr(sum(Amount),Year,Company)>50 and aggr(sum(Amount),Year,Company)<700 ,'50-700',
))))
Measure Expression:
Total Amount:
(sum(total<Year,Company>Amount))
Percentage Amount:
sum(Amount)/(sum(total{$<Year,Company>}Amount))
But the Expected Result I want is to show the 100% split per each year.
Expected Result:
| Year | Company | Plan Size | Total Amount | Percentages |
| 2010 | Apple | Greate than 500 | 610 | 71% |
| 2010 | Nokia | 50-700 | 220 | 26% |
| 2010 | Samsung | Less than 50 | 30 | 3% |
| Total | 860 | 100% | ||
| 2011 | Nokia | 100-200 | 100 | 33% |
| 2011 | Samsung | 100-200 | 200 | 67% |
| Total | 300 | 100% | ||
| 2012 | Apple | 50-700 | 500 | 77% |
| 2012 | Nokia | 100-200 | 150 | 23% |
| Total | 650 | 100% | ||
| 2014 | Apple | Greate than 500 | 900 | 67% |
| 2014 | Nokia | 50-700 | 300 | 22% |
| 2014 | Samsung | 100-200 | 150 | 11% |
| Total | 1350 | 100% |
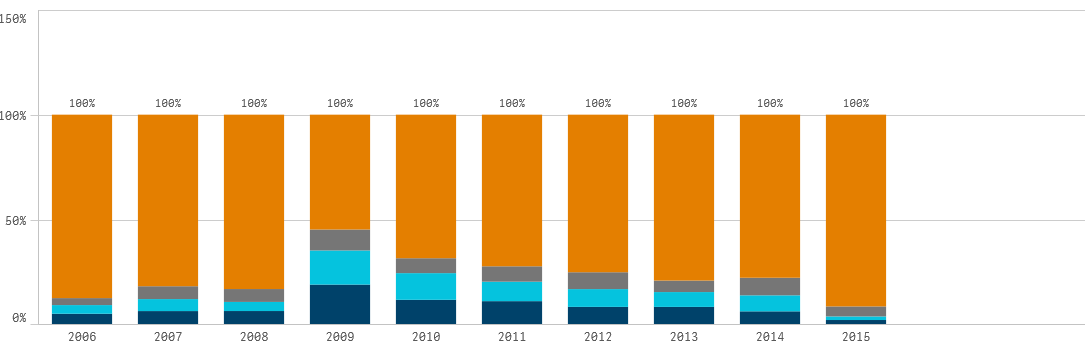
Also, I will convert this table to 100% Stacked bar color by PLAN SIZE. So that I can see how much percentage of plan size for each year.
Thanks in Advance,
-Vidya
- « Previous Replies
-
- 1
- 2
- Next Replies »
Accepted Solutions
- Mark as New
- Bookmark
- Subscribe
- Mute
- Subscribe to RSS Feed
- Permalink
- Report Inappropriate Content
So, With all the respect and information provided by the gentlemen in this thread. Both the expressions will give the right output.
Measure Expressions:
Sum(Amount)/Aggr(nodistinct sum(Amount),Year)
OR
sum(Amount) / aggr(sum(total <Year> Amount),Year,Company)
Since my report consuming more than 10 Million records of data. I have to test which is the better one in terms of
performance.
Thanks,
-Vidya
- Mark as New
- Bookmark
- Subscribe
- Mute
- Subscribe to RSS Feed
- Permalink
- Report Inappropriate Content
Hi All,
I was able to find the solution. All I need to change the percentage expression. Which is.
sum(Amount)/aggr(nodistinct sum(Amount),Year).
However, I have to convert this result set into a 100% stacked bar.
Thanks,
-Vidya
- Mark as New
- Bookmark
- Subscribe
- Mute
- Subscribe to RSS Feed
- Permalink
- Report Inappropriate Content
Better yet, use this
Sum(Amount)/Sum(TOTAL <Year>Amount)
- Mark as New
- Bookmark
- Subscribe
- Mute
- Subscribe to RSS Feed
- Permalink
- Report Inappropriate Content
I tried this expression but I am getting the wrong Percentage split.
Thanks,
-Vidya
- Mark as New
- Bookmark
- Subscribe
- Mute
- Subscribe to RSS Feed
- Permalink
- Report Inappropriate Content
Seems like something to do with the calculated dimension.... Not sure why it creates an issue
- Mark as New
- Bookmark
- Subscribe
- Mute
- Subscribe to RSS Feed
- Permalink
- Report Inappropriate Content
How come?
- Mark as New
- Bookmark
- Subscribe
- Mute
- Subscribe to RSS Feed
- Permalink
- Report Inappropriate Content
add the calculated dimension and you will see what he means
- Mark as New
- Bookmark
- Subscribe
- Mute
- Subscribe to RSS Feed
- Permalink
- Report Inappropriate Content
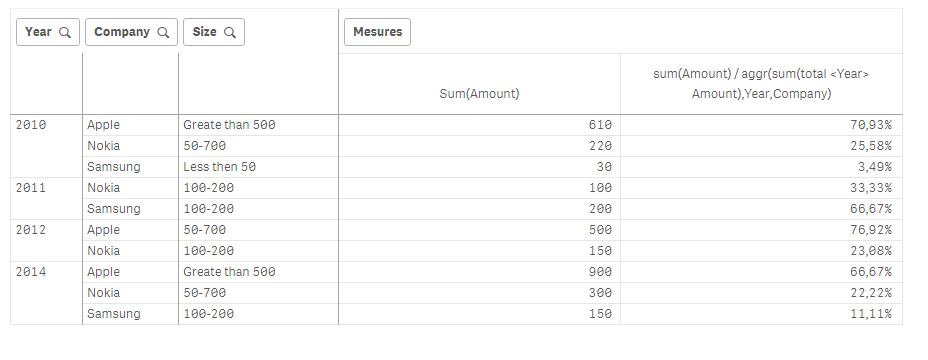
Yes. If you add the calculated dimension the results will vary.
if(aggr(sum(Amount),Year,Company)<50,'Less then 50',
if(aggr(sum(Amount),Year,Company)>=100 and aggr(sum(Amount),Year,Company)<=200 ,'100-200',
if(aggr(sum(Amount),Year,Company)>500,'Greate than 500',
if(aggr(sum(Amount),Year,Company)>50 and aggr(sum(Amount),Year,Company)<700 ,'50-700',
))))
Thanks,
-Vidya
- Mark as New
- Bookmark
- Subscribe
- Mute
- Subscribe to RSS Feed
- Permalink
- Report Inappropriate Content
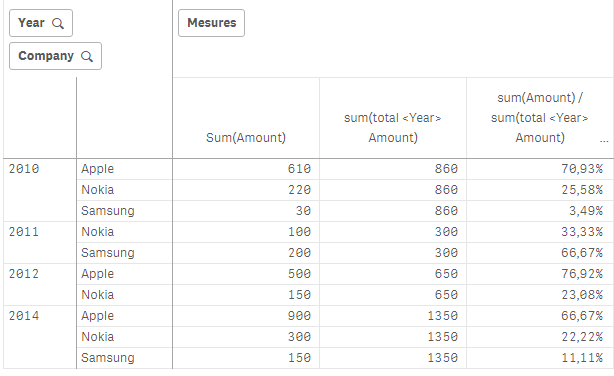
Ah I see !
change ur measure to :
sum(Amount) / aggr(sum(total <Year> Amount),Year,Company)
result:
- Mark as New
- Bookmark
- Subscribe
- Mute
- Subscribe to RSS Feed
- Permalink
- Report Inappropriate Content
Hi,
After converting the Pivot table to a 100% stacked bar chart. I got it what I want. . There might be a better solution than this. But as of now, this solution helped me in fixing my issue.
Thanks,
-Vidya
- « Previous Replies
-
- 1
- 2
- Next Replies »