Unlock a world of possibilities! Login now and discover the exclusive benefits awaiting you.
- Qlik Community
- :
- Forums
- :
- Analytics
- :
- New to Qlik Analytics
- :
- Color by expression in Treemaps Qlik Sense
- Subscribe to RSS Feed
- Mark Topic as New
- Mark Topic as Read
- Float this Topic for Current User
- Bookmark
- Subscribe
- Mute
- Printer Friendly Page
- Mark as New
- Bookmark
- Subscribe
- Mute
- Subscribe to RSS Feed
- Permalink
- Report Inappropriate Content
Color by expression in Treemaps Qlik Sense
Hi ,
I had an app with a treemap chart, colored by measure. The app was created with Qlik Sense Desktop 1.0
Now I m working with the 3.0 SR1 and when I tried to redo the same treemap, (in same sheet), it came up with a different scale of colors.
I was surprised, so I opened an app "Sales Analysis" downloaded from the community (from M.Tarallo - Re: Treemaps In Qlik Sense), and I copied and paste a treemap that was there, in the same sheet , and it changed!
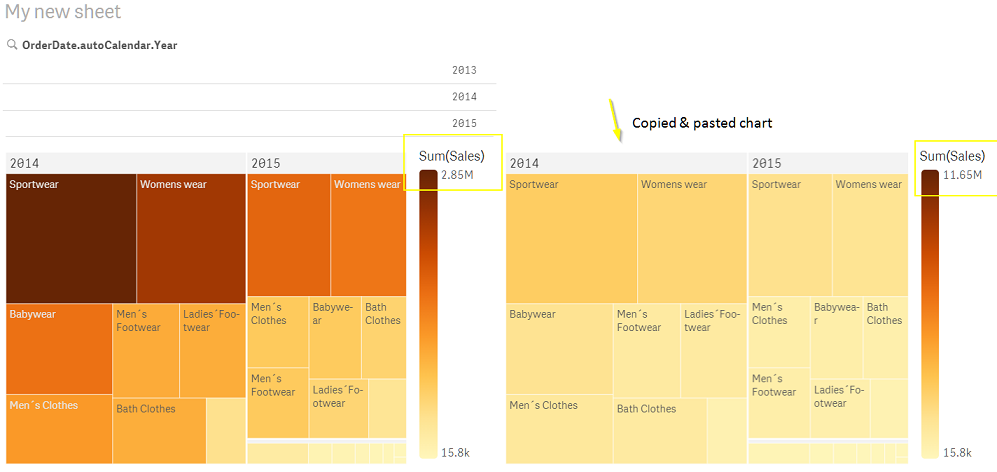
It seems to be taking a different top limit for the scale. The one on the left $2.85M is me maximun value for a Category within a Year.
The one on the right, $11,65M is the maximun value of a complete Year (2014 in this case).
Can anyone help me?
Thanks!