Unlock a world of possibilities! Login now and discover the exclusive benefits awaiting you.
- Qlik Community
- :
- Forums
- :
- Analytics
- :
- New to Qlik Analytics
- :
- Color difference in Bar Chart after applying Color...
- Subscribe to RSS Feed
- Mark Topic as New
- Mark Topic as Read
- Float this Topic for Current User
- Bookmark
- Subscribe
- Mute
- Printer Friendly Page
- Mark as New
- Bookmark
- Subscribe
- Mute
- Subscribe to RSS Feed
- Permalink
- Report Inappropriate Content
Color difference in Bar Chart after applying ColorMix
Hello All,
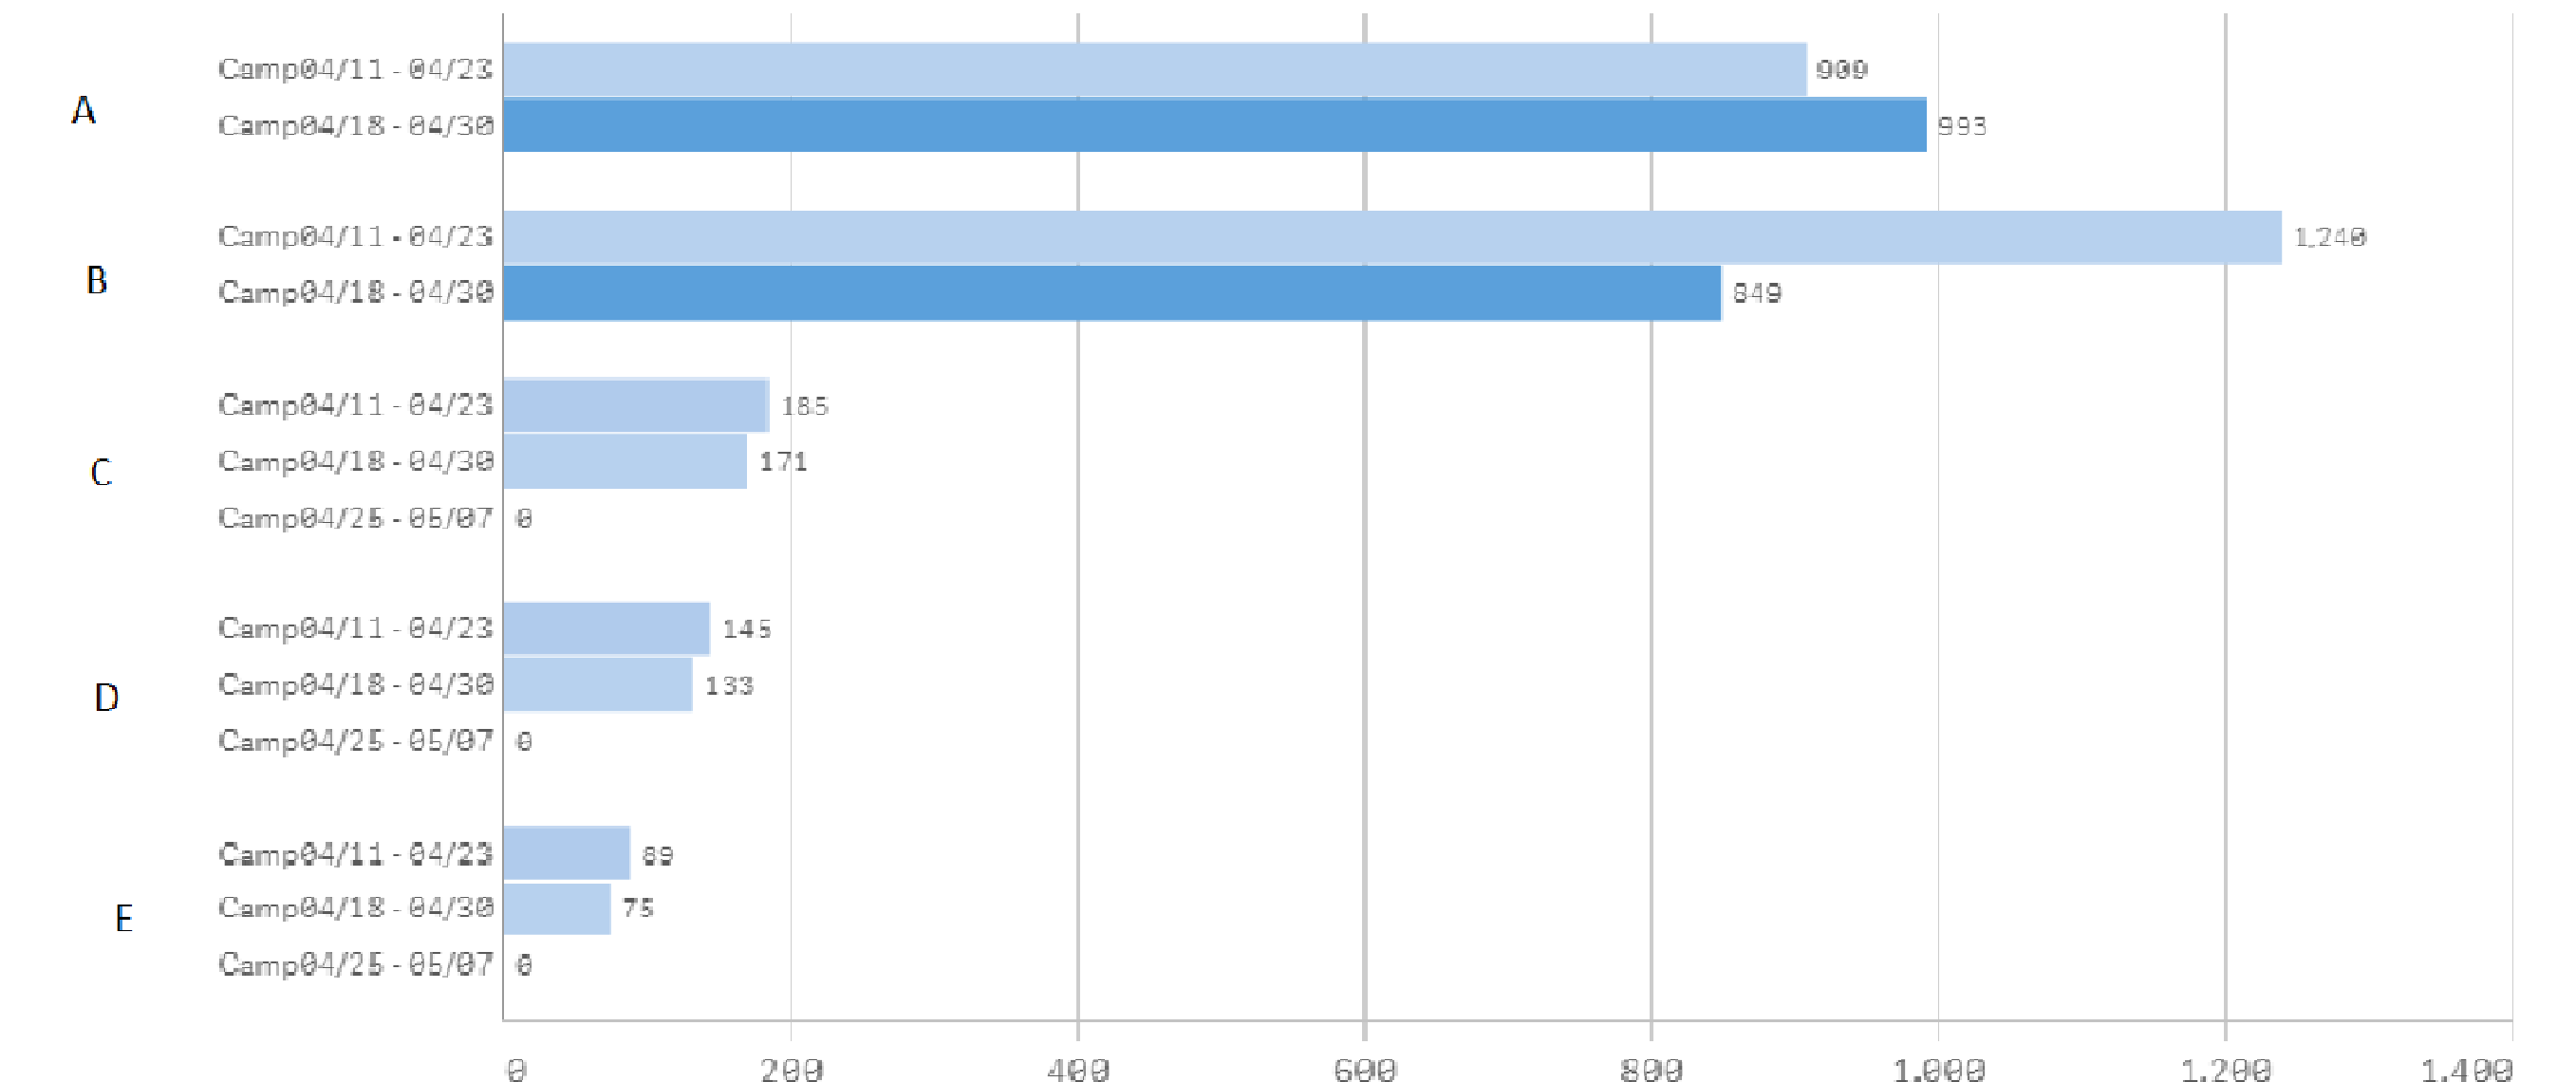
I wanted to have customized colors for different campaigns, So i applied expressions to get that in Colors and Legend section by removing auto. After applying different colors for bars even though i'm getting color differences for different campaigns, there is slightly color difference when it comes to second dimension.
My goal is to maintain the same color in all the dimensions i have used.
Attached below for a reference
From the above attached figure:
For the Camp4/18-4/30 we have same color code in both A and B, but if we look at C, D, E those looks different.
Formula i used in colors and legend:
ColorMix2( (rank(New_Campaign_Name)/(noofrows(TOTAL)/6))-1 ,rgb(0,112,200),rgb(142,180,227),rgb(198,217,241))
Dimension:New_Campaign_Name
Measure:sum(Sum)
In data load editor:
LOAD
`client_id`,
`client_name`,
`batch_name`,
`batch_meta_data_id`,
`campaign_id`,
`start_date`,
`campaign_name`,
expiration_date,
expFlag,
If(SubStringCount(batch_name,'CRF') and SubStringCount(batch_name,'LPC'),'CRF & LPC',if(wildmatch(batch_name,'*CRF'),'CRF',If(SubField(campaign_name, '_', 1) = 'Existing','Existing',if(SubField(campaign_name, '_', 1) = 'New','New',batch_name)))) as Segment_Name,
'Camp' & Replace(Left(RIGHT(campaign_name, 21),5), '-', '/') & ' - ' & Replace(Left(RIGHT(campaign_name, 10),5), '-', '/')
As New_Campaign_Name
Resident CustomCampaignTable Order by batch_meta_data_id, campaign_id desc;
Drop Table CustomCampaignTable;
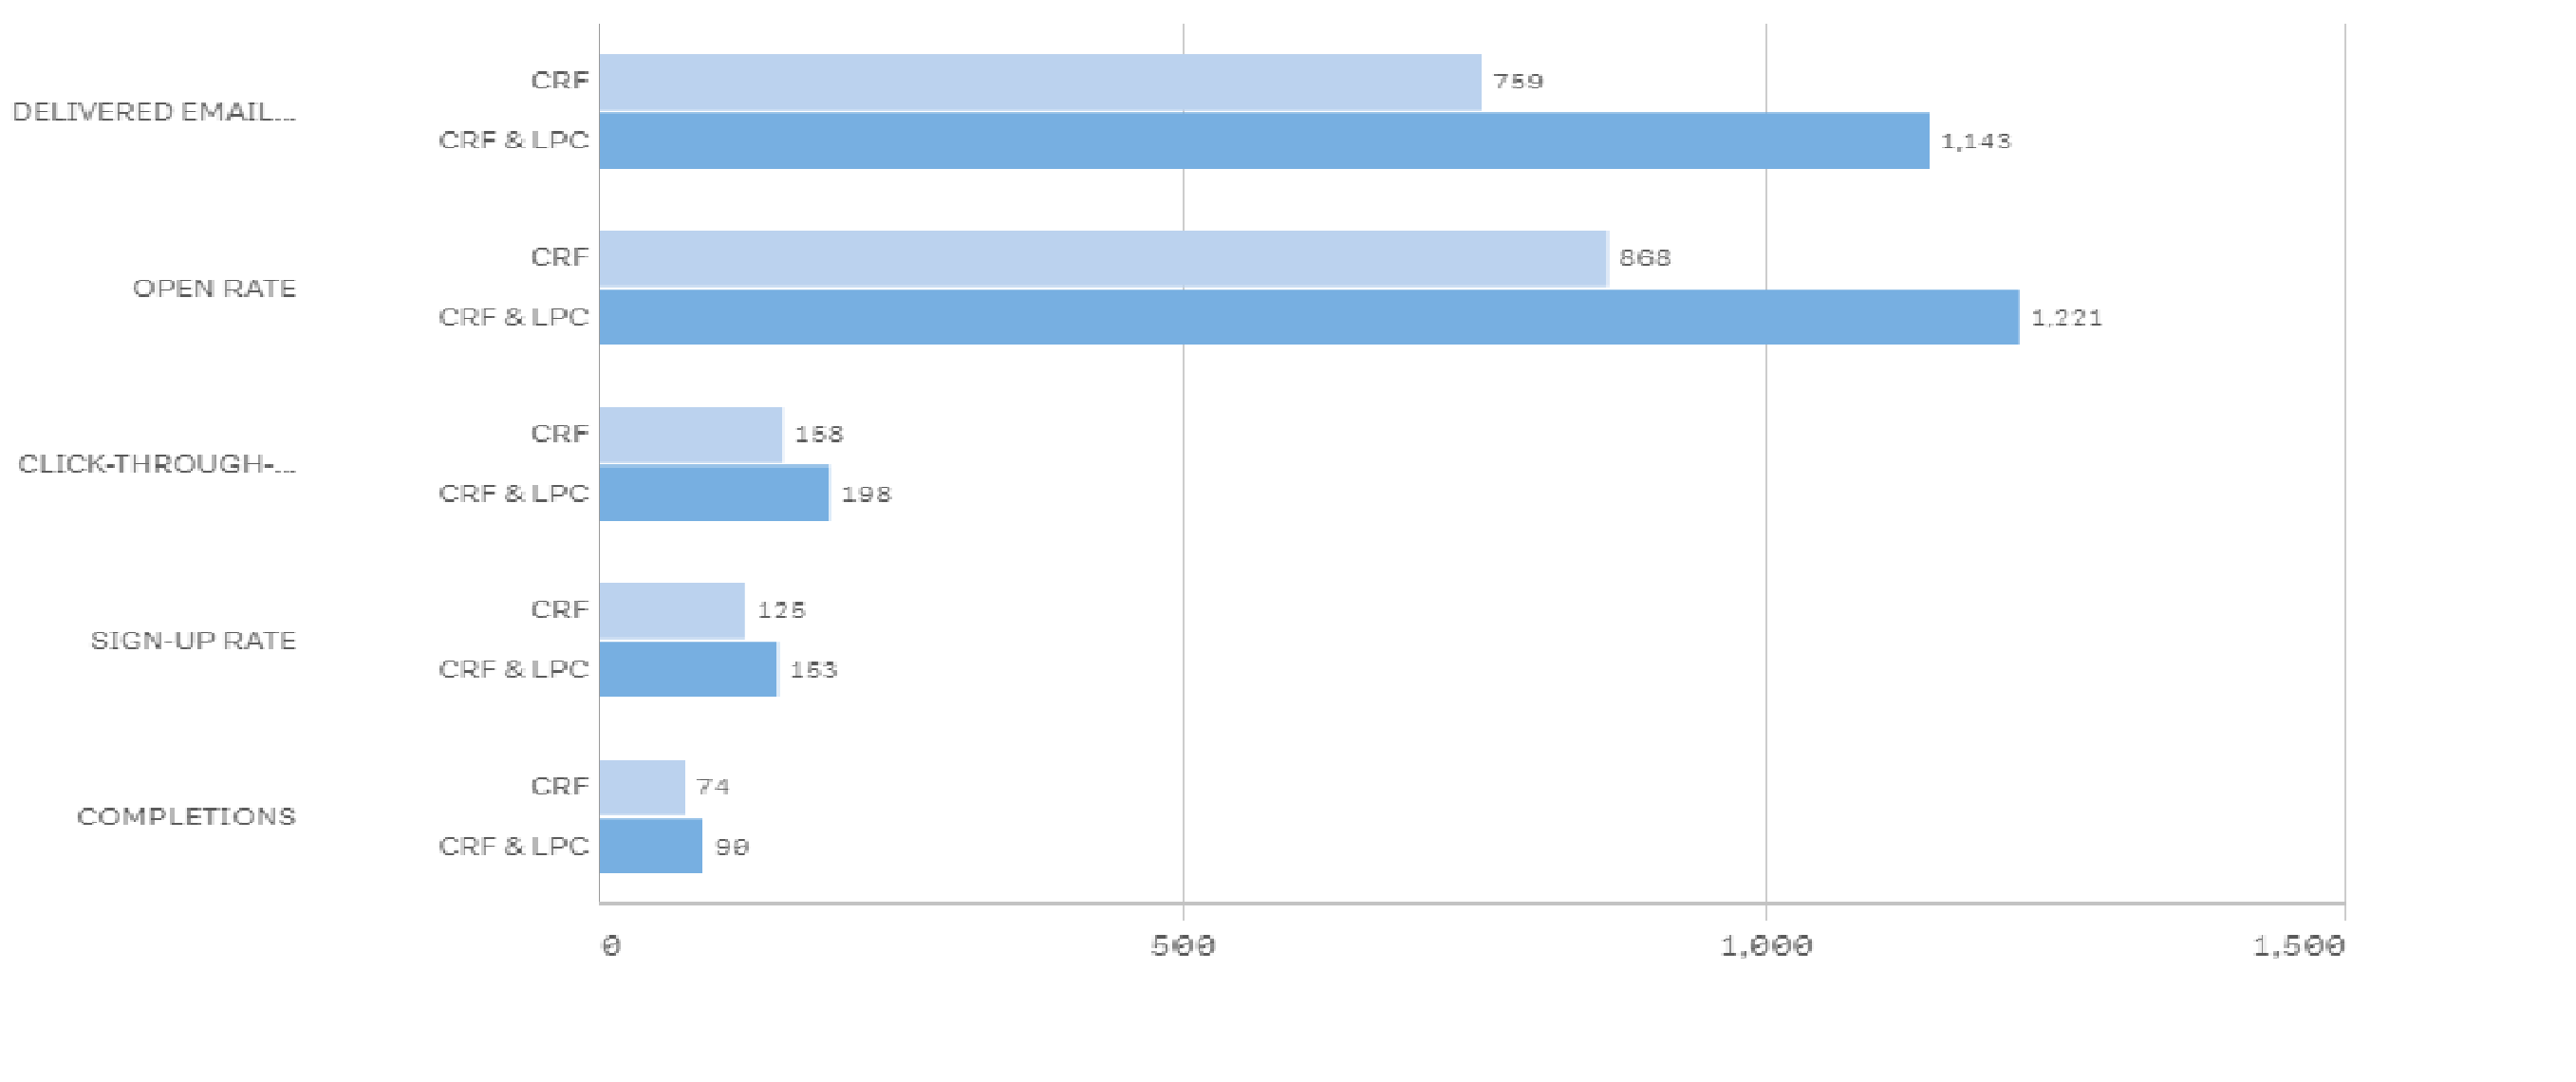
Another graph which i'm getting correct color code is:

Dimension:Segment_Name
Measure:sum(Sum)
Same data load editor as given above.
Qvf Attached:
Waiting for your valuable replies,,,
Best Regards