Unlock a world of possibilities! Login now and discover the exclusive benefits awaiting you.
- Qlik Community
- :
- Forums
- :
- Analytics
- :
- New to Qlik Analytics
- :
- Color scheme in qliksense for bar chart
- Subscribe to RSS Feed
- Mark Topic as New
- Mark Topic as Read
- Float this Topic for Current User
- Bookmark
- Subscribe
- Mute
- Printer Friendly Page
- Mark as New
- Bookmark
- Subscribe
- Mute
- Subscribe to RSS Feed
- Permalink
- Report Inappropriate Content
Color scheme in qliksense for bar chart
Hi...
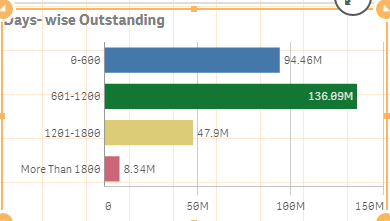
I have used 1 dimension and 1 measure for bar chart and I want to set the colour of each bar manually how can I do that.
For example in the following chart I want to show Green color for '0-600' blue for 601-1200.
Accepted Solutions
- Mark as New
- Bookmark
- Subscribe
- Mute
- Subscribe to RSS Feed
- Permalink
- Report Inappropriate Content
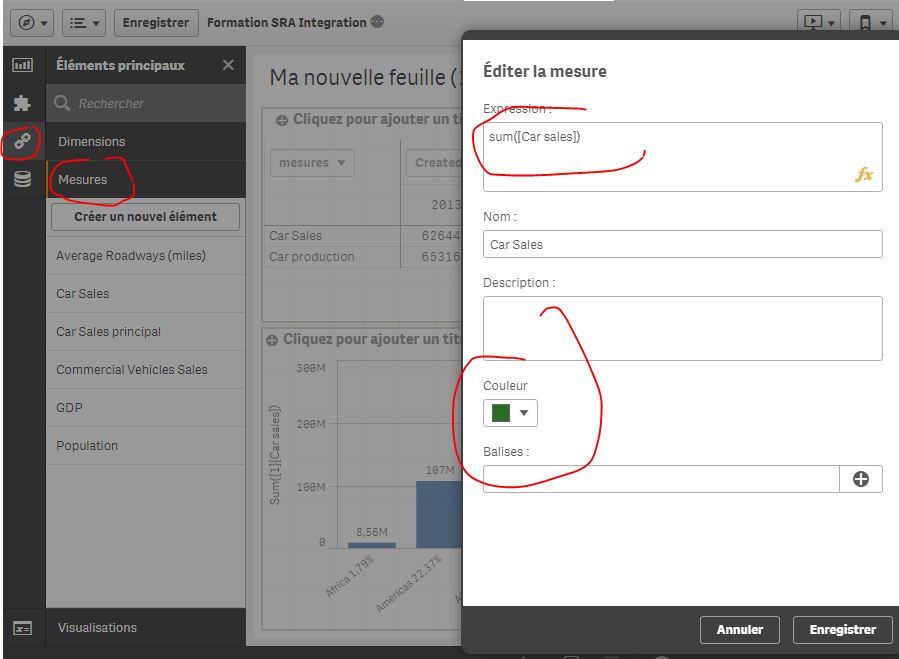
Are you using Qlik Sense 3.2?
If so, add your 2 measures as master items (master measures) and add a color there to each measure.
- Mark as New
- Bookmark
- Subscribe
- Mute
- Subscribe to RSS Feed
- Permalink
- Report Inappropriate Content
choose cutom culor, by expression:
if(dimension='0-600',green(),
if(dimension='601-1200',blue(),
if(dimension='1201-1800',red(),
black()
))))
change color expressions as your like;
- Mark as New
- Bookmark
- Subscribe
- Mute
- Subscribe to RSS Feed
- Permalink
- Report Inappropriate Content
Thank you Omae Bensalem
- Mark as New
- Bookmark
- Subscribe
- Mute
- Subscribe to RSS Feed
- Permalink
- Report Inappropriate Content
Hie,
I have used 2 measrues in a bar chart, want to give a custom color to each measure how can I do this.
Thank You
- Mark as New
- Bookmark
- Subscribe
- Mute
- Subscribe to RSS Feed
- Permalink
- Report Inappropriate Content
Hi, use for each measures a different Expression (see Omars answer).
- Mark as New
- Bookmark
- Subscribe
- Mute
- Subscribe to RSS Feed
- Permalink
- Report Inappropriate Content
Are you using Qlik Sense 3.2?
If so, add your 2 measures as master items (master measures) and add a color there to each measure.
- Mark as New
- Bookmark
- Subscribe
- Mute
- Subscribe to RSS Feed
- Permalink
- Report Inappropriate Content
Hie...I am using QlikSense 3.1
Is there any soloution in 3.1?
- Mark as New
- Bookmark
- Subscribe
- Mute
- Subscribe to RSS Feed
- Permalink
- Report Inappropriate Content
Just upgrade to the latest version; It's free and won't harm or affect any of your current work
- Mark as New
- Bookmark
- Subscribe
- Mute
- Subscribe to RSS Feed
- Permalink
- Report Inappropriate Content
Thank you so much...It worked for me
- Mark as New
- Bookmark
- Subscribe
- Mute
- Subscribe to RSS Feed
- Permalink
- Report Inappropriate Content
custome color---->color by expression
syntax:
=if(Year='2009' ,red(),
if(Year='2010', Blue(),
If(Year='2011',Green(),
if(Year='2012',black()))))
Year------Dimension
2009,2010,2011,2012 are values of year
.png)