Unlock a world of possibilities! Login now and discover the exclusive benefits awaiting you.
- Qlik Community
- :
- Forums
- :
- Analytics
- :
- New to Qlik Analytics
- :
- Colour based on value
- Subscribe to RSS Feed
- Mark Topic as New
- Mark Topic as Read
- Float this Topic for Current User
- Bookmark
- Subscribe
- Mute
- Printer Friendly Page
- Mark as New
- Bookmark
- Subscribe
- Mute
- Subscribe to RSS Feed
- Permalink
- Report Inappropriate Content
Colour based on value
Hi all,
I have a straight table with one measure that result is like below
1
2
3
4
5
6
7
8
9 like that I need to give this bg colour light to dark how can I give?
- Tags:
- coolour
- strighttable
- « Previous Replies
- Next Replies »
Accepted Solutions
- Mark as New
- Bookmark
- Subscribe
- Mute
- Subscribe to RSS Feed
- Permalink
- Report Inappropriate Content
Check with this
=ARGB((MAX(TOTAL TimeLefttoBreachSLA) - Min(TOTAL TimeLefttoBreachSLA))/255 * TimeLefttoBreachSLA, 255, 0, 0)
- Mark as New
- Bookmark
- Subscribe
- Mute
- Subscribe to RSS Feed
- Permalink
- Report Inappropriate Content
May be like this
ARGB(Expression * 25, 192, 192, 192)
- Mark as New
- Bookmark
- Subscribe
- Mute
- Subscribe to RSS Feed
- Permalink
- Report Inappropriate Content
sorry sunny wrong input 
its dimension I calculated in backend and I am calling that as a dimension.
above not working for dimension
- Mark as New
- Bookmark
- Subscribe
- Mute
- Subscribe to RSS Feed
- Permalink
- Report Inappropriate Content
May be this
ARGB(Dimension* 25, 192, 192, 192)
- Mark as New
- Bookmark
- Subscribe
- Mute
- Subscribe to RSS Feed
- Permalink
- Report Inappropriate Content
tried in measure also its not working
check below
- Mark as New
- Bookmark
- Subscribe
- Mute
- Subscribe to RSS Feed
- Permalink
- Report Inappropriate Content
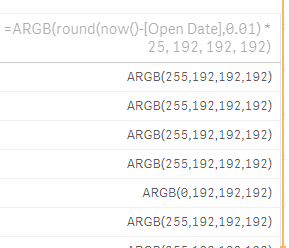
still not working
same result which I attached below image for both dim,measure aswell
- Mark as New
- Bookmark
- Subscribe
- Mute
- Subscribe to RSS Feed
- Permalink
- Report Inappropriate Content
This is a color, right? Also, What is the values for Open Date?
- Mark as New
- Bookmark
- Subscribe
- Mute
- Subscribe to RSS Feed
- Permalink
- Report Inappropriate Content
Can you provide small sample for this.
- Mark as New
- Bookmark
- Subscribe
- Mute
- Subscribe to RSS Feed
- Permalink
- Report Inappropriate Content
You can try this expression in your Background Properties of your chart.
- Mark as New
- Bookmark
- Subscribe
- Mute
- Subscribe to RSS Feed
- Permalink
- Report Inappropriate Content
Hi Anand& sunny
PFA. first sheet ,time left to breach sla column values should be colored by value light color to dark.
- « Previous Replies
- Next Replies »