Unlock a world of possibilities! Login now and discover the exclusive benefits awaiting you.
- Qlik Community
- :
- Forums
- :
- Analytics
- :
- New to Qlik Analytics
- :
- Combining set analyses?
- Subscribe to RSS Feed
- Mark Topic as New
- Mark Topic as Read
- Float this Topic for Current User
- Bookmark
- Subscribe
- Mute
- Printer Friendly Page
- Mark as New
- Bookmark
- Subscribe
- Mute
- Subscribe to RSS Feed
- Permalink
- Report Inappropriate Content
Combining set analyses?
I have people that rotate in and out of positions. I'm trying to display the person currently residing in the position and then the replacement person in another column. so, something like this.
Position CurrentEmp ReplacementEmp
clerk123 Maria John
however, my data looks like this..
Position Name DateRotation DateIncoming DepDays IncomingDays
clerk123 Maria 3/31/2017 14
clerk123 John 4/6/2017 20
that's a very simplified version, but you get the gist. how can I get john to display in the replacementemp column?
Thanks,
Maria
- Mark as New
- Bookmark
- Subscribe
- Mute
- Subscribe to RSS Feed
- Permalink
- Report Inappropriate Content
Would really need to see a sample of your data and what you want the visualization to look like in order to give a decent answer.
Will you only have 2 rows of data per position? Is the code in the Position column unique to each position?
- Mark as New
- Bookmark
- Subscribe
- Mute
- Subscribe to RSS Feed
- Permalink
- Report Inappropriate Content
hi. here is more of a subset of the data from the database...this is not the real data. it's a very simplistic version that helps you see the gist of what I'm doing.
PositionID Name DateRotation DateIncoming DepartDays IncomingDays
clerk123 Maria 3/31/2017 prior to 2015 14 doesn't matter
clerk123 John 4/62020 4/6/2017 a long time 20
janitor123 Chris 7/31/2017 prior to 2015 130 doesn't matter
janitor123 Harry 7/31/2020 7/1/2017 a long time 100
super123 Nina 4/1/2017 prior to 2015 21 doesn't matter
super123 Dave 12/31/2019 3/31/2017 a long time 11
manager123 Vern 3/31/2017 prior 14 doesn't matter
this is how I want to display it..
Position CurrentEmp ReplacementEmp
clerk123 Maria John
jan123 Chris Harry
super123 Nina Dave
manager123 Vern
so, the positionID is the link and the dates would determine current v replacement. this will allow leadership to see the gaps in personnel. ie, everything is staffed except manager123 has no replacement. it seems like it should be simple. can't I just grab the ones current in one set, then grab the replacements in another set and union them on the positionID? can I do this in a dimension? or do I have to do it within the data load? it seems like I shouldn't have to alter the data itself because everything is there...I just need to figure out how to manipulate within the view. any suggestions? what am I misunderstanding?
- Mark as New
- Bookmark
- Subscribe
- Mute
- Subscribe to RSS Feed
- Permalink
- Report Inappropriate Content
Find the attachment.
I'm not sure if that's what you want, you can test it on large scale (your data)....
Remove Order by Position from the script, it's pretty much useless.
I know you looking for Qlik Sense and I gave you QVW but the Script will be same in both the tools.
Just copy paste the script you need into your QS app.
Thanks.
- Mark as New
- Bookmark
- Subscribe
- Mute
- Subscribe to RSS Feed
- Permalink
- Report Inappropriate Content
hi. I don't have a way to upload qvw due to the security of our network. can you copy and paste the code?
Thank you so much..
- Mark as New
- Bookmark
- Subscribe
- Mute
- Subscribe to RSS Feed
- Permalink
- Report Inappropriate Content
I used my own data, your load was complicated but it's same load.
Data:
LOAD Distinct * INLINE [
Position, Name, Rotation, Incoming
Clerk, Maria, 1/5/2017, 8/7/2015
Clerk, John , 1/6/2020, 8/8/2017
Janitor, Chris, 1/7/2017, 8/9/2015
Janitor, Harry, 1/8/2017, 8/10/2017
Super, Nina, 1/9/2020, 8/11/2015
Super, Dave, 1/10/2019, 8/12/2017
Manager, Vern, 1/11/2017, 8/13/2015
];
load
Position,
if(Incoming>today(),Name) as V1,
if(Incoming<today(),Name) as V2
Resident Data
;
The resident load I did in script and in front end I use pivot table or you can use St table as well..
Dimension-Position
Expression-
Current: only( aggr( V2, V1, V2))
Replacement: only( aggr( V1, V2, V1))
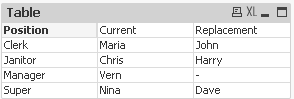
End result I got is below.
Edit: There can be a better way to do it I'm no expert in Qlik but someone else can help you to optimize it a better way?