Unlock a world of possibilities! Login now and discover the exclusive benefits awaiting you.
- Qlik Community
- :
- Forums
- :
- Analytics
- :
- New to Qlik Analytics
- :
- Combo Chart Problem
- Subscribe to RSS Feed
- Mark Topic as New
- Mark Topic as Read
- Float this Topic for Current User
- Bookmark
- Subscribe
- Mute
- Printer Friendly Page
- Mark as New
- Bookmark
- Subscribe
- Mute
- Subscribe to RSS Feed
- Permalink
- Report Inappropriate Content
Combo Chart Problem
Hello
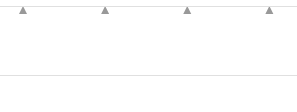
I have a combochart which dimension changes according to an option list, the chart doesn't show entirely when I change dimensions (little triangles show on top) , only when I choose the most detailed one (lower level) .

Regards
Accepted Solutions
- Mark as New
- Bookmark
- Subscribe
- Mute
- Subscribe to RSS Feed
- Permalink
- Report Inappropriate Content
I fixed it by changing the max parameter of the axis range.The Auto option doesn't seem to work fine Thank you
- Mark as New
- Bookmark
- Subscribe
- Mute
- Subscribe to RSS Feed
- Permalink
- Report Inappropriate Content
Hello Meriem,
As one of the community administrators and moderators of the Qlik Sense forums, I like to have more information in regards to issues and discussions posted so our community members can benefit from the possible solutions. Can you please expand on the issue and provide additional information to this issue?
- Is this for Qlik Sense?
- How are you changing the dimension in the options list? If using Qlik Sense are you using a Drilldown dimension? - or are using some technique? What it sounds like you are using cyclic groups which is not an out of the box feature in Qlik Sense.
Please let us know as soon as you can.
Regards,
Mike
Mike Tarallo
Qlik
- Mark as New
- Bookmark
- Subscribe
- Mute
- Subscribe to RSS Feed
- Permalink
- Report Inappropriate Content
Hello Michael , Yes it is for Qliksense.
- Mark as New
- Bookmark
- Subscribe
- Mute
- Subscribe to RSS Feed
- Permalink
- Report Inappropriate Content
Can you provide more information as I described in the previous post. Currently this thread does not relay enough information in regards to the problem and solution.
Mike
Mike Tarallo
Qlik
- Mark as New
- Bookmark
- Subscribe
- Mute
- Subscribe to RSS Feed
- Permalink
- Report Inappropriate Content
Those arrows indicate that you have datapoints outside of the current plot range. Have you set an explicit min/max on the axis?
- Mark as New
- Bookmark
- Subscribe
- Mute
- Subscribe to RSS Feed
- Permalink
- Report Inappropriate Content
I fixed it by changing the max parameter of the axis range.The Auto option doesn't seem to work fine Thank you