Unlock a world of possibilities! Login now and discover the exclusive benefits awaiting you.
- Qlik Community
- :
- Forums
- :
- Analytics
- :
- New to Qlik Analytics
- :
- Count/Sum of Missing Steps - Bar chart
- Subscribe to RSS Feed
- Mark Topic as New
- Mark Topic as Read
- Float this Topic for Current User
- Bookmark
- Subscribe
- Mute
- Printer Friendly Page
- Mark as New
- Bookmark
- Subscribe
- Mute
- Subscribe to RSS Feed
- Permalink
- Report Inappropriate Content
Count/Sum of Missing Steps - Bar chart
Hi Everyone,
This is the most complicated query I came across, can anyone please help me?
Question:
Every candidate must follow this sequence of steps to get recruited by a company
1. Apply for Job
2. Pass the Exam
3. Interview
4. Sign the Offer Letter
5. Background Check
Some of the candidates don't reach the final step and may never get a job.
Some candidates reach the final step but might have some missing steps in between.
(Like Kyle got a job but he didn't go through the 'Pass the Exam' step so I'll count 1 missing step here.
Similary, Jack never made it to the last step, he couldn't pass the exam, so we won't consider any missing steps for him.
For King, the last step was 'Sign the Offer Letter', but he has a missing step, he didn't go through
interview, so we will count that as 1)
So basically, for any of the candidates whatever be the last step, they shouldn't have any missing steps in between.
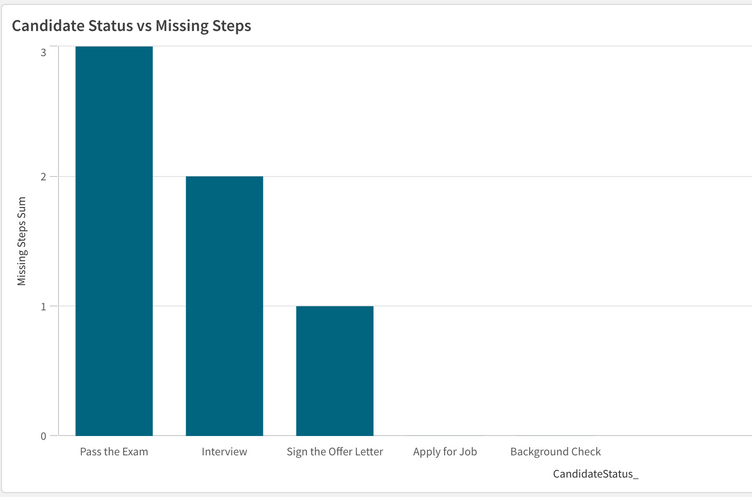
Now, I want to take the sum of missing steps and present it using a bar chart. Can anyone help please?
Here's the sample data:
Load * inline
[
Date, CandidateName, CandidateStatus, Counter
1/1/2020 ,Dan, Apply for Job, 1
1/3/2020 ,Dan, Pass the Exam, 1
1/5/2020 ,Dan, Interview, 1
1/7/2020 ,Dan, Sign the Offer Letter, 1
1/9/2020 ,Dan, Background Check, 1
2/1/2020 ,Kyle, Apply for Job, 1
2/5/2020 ,Kyle, Interview, 1
2/7/2020 ,Kyle, Sign the Offer Letter, 1
2/8/2020 ,Kyle, Background Check, 1
1/9/2020 ,Jack, Apply for Job, 1
2/8/2020 ,King, Apply for Job, 1
2/9/2020 ,King, Pass the Exam, 1
2/11/2020 ,King, Sign the Offer Letter, 1
3/11/2020 ,Steve, Apply for Job, 1
4/11/2020 ,Steve, Interview, 1
5/11/2020 ,Ray, Apply for Job, 1
6/11/2020 ,Ray, Background Check, 1
];
You can copy the data to Qlikview/Qliksense, anything is okay.
Output: This should be the output
@Kushal_Chawda @QFabian @MayilVahanan @rwunderlich @dilipranjith @Taoufiq_Zarra
- Tags:
- aggr()
