Unlock a world of possibilities! Login now and discover the exclusive benefits awaiting you.
- Qlik Community
- :
- Forums
- :
- Analytics
- :
- New to Qlik Analytics
- :
- Count of Items in Chart and Table differs
- Subscribe to RSS Feed
- Mark Topic as New
- Mark Topic as Read
- Float this Topic for Current User
- Bookmark
- Subscribe
- Mute
- Printer Friendly Page
- Mark as New
- Bookmark
- Subscribe
- Mute
- Subscribe to RSS Feed
- Permalink
- Report Inappropriate Content
Count of Items in Chart and Table differs
Hello Everyone,
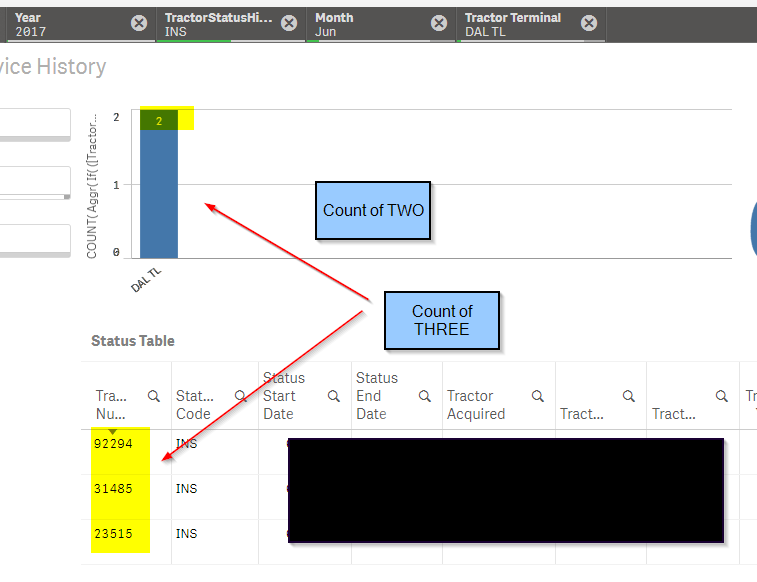
I have a chart and a table that both have the same backing formula. The fundamental problem is that in my Table, I have 3 rows, and in my Bar Chart, I have a count of "2".
Before I show the chart and table, my measures look like so:
Bar Chart:
COUNT(
 Aggr(
  If(
  ([TractorStatusHistory.StatusStartDate] <  Min(TOTAL CalDate)) and
  ([TractorStatusHistory.StatusEndDate] > Max(TOTAL CalDate)),
  [%tractorNumber]),
        [%tractorNumber])
)
Table:
If(
  [TractorStatusHistory.StatusStartDate] < Min(TOTAL CalDate)
  and [TractorStatusHistory.StatusEndDate] > Max(TOTAL CalDate),
  [%tractorNumber]
)
While they look the same, the output is quite different with the Table having 3 rows, and the Bar Chart counting 2
Does anyone have a clue of how I can see the exact rows making up the bar chart? Or better yet, are the two statements above semantically equivalent? I'm not sure how to proceed.
Any help is greatly appreciated.
- Mark as New
- Bookmark
- Subscribe
- Mute
- Subscribe to RSS Feed
- Permalink
- Report Inappropriate Content
Does it make any difference if you use this
Sum(Aggr(If([TractorStatusHistory.StatusStartDate] < Min(TOTAL CalDate) and [TractorStatusHistory.StatusEndDate] > Max(TOTAL CalDate), 1, 0), [%tractorNumber]))
- Mark as New
- Bookmark
- Subscribe
- Mute
- Subscribe to RSS Feed
- Permalink
- Report Inappropriate Content
For reasons that I am completely unaware of, the following solution gave me what I wanted.
COUNT( DISTINCT
If(
([TractorStatusHistory.StatusStartDate] < Min(TOTAL CalDate)) and
([TractorStatusHistory.StatusEndDate] > Max(TOTAL CalDate)),
[%tractorNumber]
)
)
I'm not sure why or how this works.
- Mark as New
- Bookmark
- Subscribe
- Mute
- Subscribe to RSS Feed
- Permalink
- Report Inappropriate Content
Really? I would love to see a sample where this worked 
- Mark as New
- Bookmark
- Subscribe
- Mute
- Subscribe to RSS Feed
- Permalink
- Report Inappropriate Content
My guess is that the Aggr was affecting the value returned by the Min/Max CalDate, even though TOTAL was specified. maybe it was within the Aggr grouping?