Unlock a world of possibilities! Login now and discover the exclusive benefits awaiting you.
- Qlik Community
- :
- Forums
- :
- Analytics
- :
- New to Qlik Analytics
- :
- Creating a Top 25(50, 100) sales button
- Subscribe to RSS Feed
- Mark Topic as New
- Mark Topic as Read
- Float this Topic for Current User
- Bookmark
- Subscribe
- Mute
- Printer Friendly Page
- Mark as New
- Bookmark
- Subscribe
- Mute
- Subscribe to RSS Feed
- Permalink
- Report Inappropriate Content
Creating a Top 25(50, 100) sales button
I'm trying to create a Top 25, 50, 100 sales button or slider that can easily show me the sales of inventory sold.
Any help would be appreciated!
- « Previous Replies
-
- 1
- 2
- Next Replies »
- Mark as New
- Bookmark
- Subscribe
- Mute
- Subscribe to RSS Feed
- Permalink
- Report Inappropriate Content
Hi Ashley - at the moment, with Qlik Sense Desktop, this may be possible with extension objects. Are you interested in learning that approach? - I can provide you with a sample.
You can do this with QlikView as well out of the box.
let me know.
Mike
Mike Tarallo
Qlik
- Mark as New
- Bookmark
- Subscribe
- Mute
- Subscribe to RSS Feed
- Permalink
- Report Inappropriate Content
Sure! I will try it. I've been playing around with it but can't seem to find a solution so anything will help!
- Mark as New
- Bookmark
- Subscribe
- Mute
- Subscribe to RSS Feed
- Permalink
- Report Inappropriate Content
OK - let me see what we can do.
Do you have QlikView Personal as well?
if not you can get it here: BI Platform Free Download, QlikView Personal Edition | Qlik
Note that QlikView and Sense are two different products that can address similar and different use cases.
I can get into more detail about this if needed, in the mean-time you may want to check out this blog post:
http://community.qlik.com/blogs/qlikviewdesignblog/2014/07/29/view-or-sense
I'll come back to you shortly.
Mike
Mike Tarallo
Qlik
- Mark as New
- Bookmark
- Subscribe
- Mute
- Subscribe to RSS Feed
- Permalink
- Report Inappropriate Content
No, I don't. But I'm hoping to put this sales top on like a slider option so that if we want only top 10 we can get that or if we want top 50 we can also easily get that.
- Mark as New
- Bookmark
- Subscribe
- Mute
- Subscribe to RSS Feed
- Permalink
- Report Inappropriate Content
Hi Ashley,
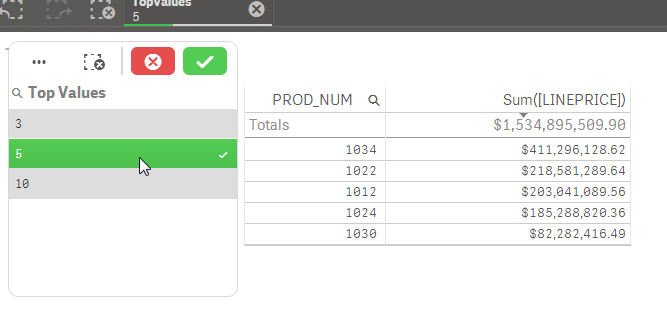
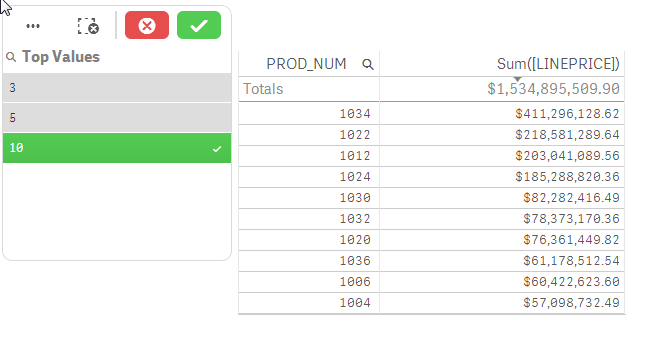
For Qlik Sense version 0.96, here's a work-around that I did for one of my personal apps. I've created a data island in my script by using the INLINE command. This inline table has only one field and I gave it three values: 25, 50, and 100. For the measures in the user interface, I added an IF statement where the original expression will only calculate if the RANK of the expression is <= the MAX of the inline table value (25, 50, 100). For false values, I gave the measure a null. Finally, I added a filter pane that has the three values displayed so users can select the top 25, 50, or 100 rows. Try it out!
- Mark as New
- Bookmark
- Subscribe
- Mute
- Subscribe to RSS Feed
- Permalink
- Report Inappropriate Content
Hi Ashley - try this sample attached:
- Copy to: C:\Users\<user>\Documents\Qlik\Sense\Apps
- Start Sense Desktop
Let me know if this is the functionality you are looking for. However there isn't a slide yet to control the values. I used a listbox with the value. That could be done with an extension object though.
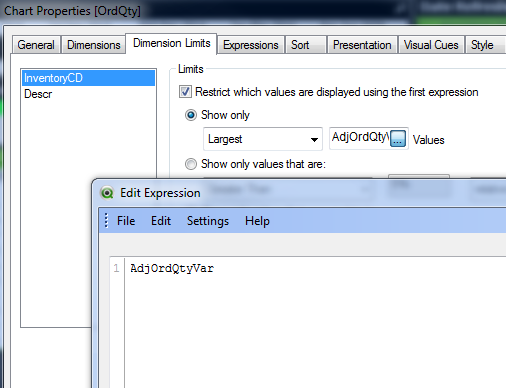
Note in the table object in the columns, there is a Limitation option, you can choose a fixed value - or make it equal to an expression. I simply chose to make it equal to the value that is selected in the listbox by using the TopValue field name from the inline table and sort the table object by the sales value descending.
The inline table is defined in the load script - you can use the Data Load Editor to view and modify that in our example.
Note: I did not include the sample data - so loading this app again will fail.


Please let me know if this is close to what you were thinking.
Mike
Mike Tarallo
Qlik
- Mark as New
- Bookmark
- Subscribe
- Mute
- Subscribe to RSS Feed
- Permalink
- Report Inappropriate Content
Looks like i figured it out! Thanks!
- Mark as New
- Bookmark
- Subscribe
- Mute
- Subscribe to RSS Feed
- Permalink
- Report Inappropriate Content
Great - would you mind sharing a screenshot of your work - you can blur out anything sensitive. Just curious to see how you did it.
Thanks
Mike
Mike Tarallo
Qlik
- Mark as New
- Bookmark
- Subscribe
- Mute
- Subscribe to RSS Feed
- Permalink
- Report Inappropriate Content


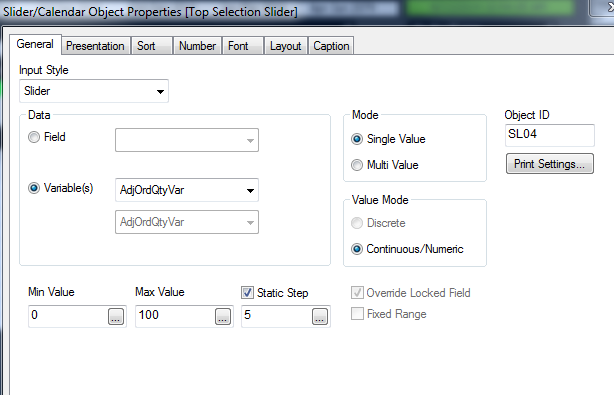
I was able to connect it using the variable.
- « Previous Replies
-
- 1
- 2
- Next Replies »