Unlock a world of possibilities! Login now and discover the exclusive benefits awaiting you.
- Qlik Community
- :
- Forums
- :
- Analytics
- :
- New to Qlik Analytics
- :
- Crosstable issue
- Subscribe to RSS Feed
- Mark Topic as New
- Mark Topic as Read
- Float this Topic for Current User
- Bookmark
- Subscribe
- Mute
- Printer Friendly Page
- Mark as New
- Bookmark
- Subscribe
- Mute
- Subscribe to RSS Feed
- Permalink
- Report Inappropriate Content
Crosstable issue
Hello, i need your help to properly load a crosstable for the following data:
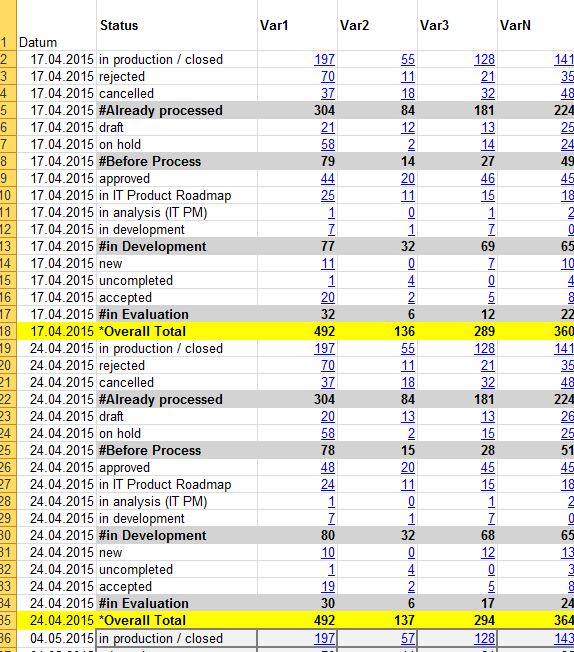
- Data source is one excel-sheet
- I want visualize Status each 'Var'-column crossed for each date
- e.g. i want to pick and visualize the Status and Var1 for the 17.04.2015, Status and Var1 for the 24.04.2015 etc.
- but also Status and Var2 for the 17.04.2015, ..., n(date) or Status and Var3 for the 17.04.2015, ..., n(date)
- The date information proceeds from 17.04.2015 to 14.08.2015 in the pattern shown above.
Any ideas? Thank you in advance!
- Mark as New
- Bookmark
- Subscribe
- Mute
- Subscribe to RSS Feed
- Permalink
- Report Inappropriate Content
I would load your data in the following structure
Date, Stage, Status, Var, Value
17.04.2015,#Already Processed, In production / Closed, Var1, 197
17.04.2015,#Already Processed, In production / Closed, Var2, 55
17.04.2015,#Already Processed, In production / Closed, Var3, 128
17.04.2015,#Already Processed, rejected, Var1, 70
17.04.2015,#Already Processed, rejected, Var2, 11
17.04.2015,#Already Processed, rejected, Var3, 21
17.04.2015,#Already Processed, cancelled, Var1, 37
17.04.2015,#Already Processed, cancelled, Var2, 18
17.04.2015,#Already Processed, cancelled, Var3, 32
17.04.2015,#Before Processed, on hold, Var1, 58
17.04.2015,#Before Processed, on hold, Var2, 2
17.04.2015,#Before Processed, on hold, Var3, 19
etc...
That structure should allow you to produce the visualisations you want plus the cross tab on the screen above.
Regards
Andy