Unlock a world of possibilities! Login now and discover the exclusive benefits awaiting you.
- Qlik Community
- :
- Forums
- :
- Analytics
- :
- New to Qlik Analytics
- :
- Cumulative growth month on month in Bar Chart
- Subscribe to RSS Feed
- Mark Topic as New
- Mark Topic as Read
- Float this Topic for Current User
- Bookmark
- Subscribe
- Mute
- Printer Friendly Page
- Mark as New
- Bookmark
- Subscribe
- Mute
- Subscribe to RSS Feed
- Permalink
- Report Inappropriate Content
Cumulative growth month on month in Bar Chart
Hello Everyone!
I am looking to create a bar chart showing month on month growth rates. I would like to see cumulative growth month on month along with a trend line so that the period where sales went down could be easily extracted, for the respective product. Please let me know how I can achieve this?
Best Regards,
Rony
- Tags:
- qlik_sense_usability
- « Previous Replies
- Next Replies »
- Mark as New
- Bookmark
- Subscribe
- Mute
- Subscribe to RSS Feed
- Permalink
- Report Inappropriate Content
It has been few days since we last worked on this... would you be able to provide the required output... what would the numbers be when you see them with MonthYear as your dimension for both
- Mark as New
- Bookmark
- Subscribe
- Mute
- Subscribe to RSS Feed
- Permalink
- Report Inappropriate Content
Yes. I was on leave for the past few days. Numbers would be the same, in percentages. One chart would be month on month and the other cumulative. I just want the dimension to be continuous, i.e, Jan-14 to July-18 in one shot, Rest all remains the same.
Rony
- Mark as New
- Bookmark
- Subscribe
- Mute
- Subscribe to RSS Feed
- Permalink
- Report Inappropriate Content
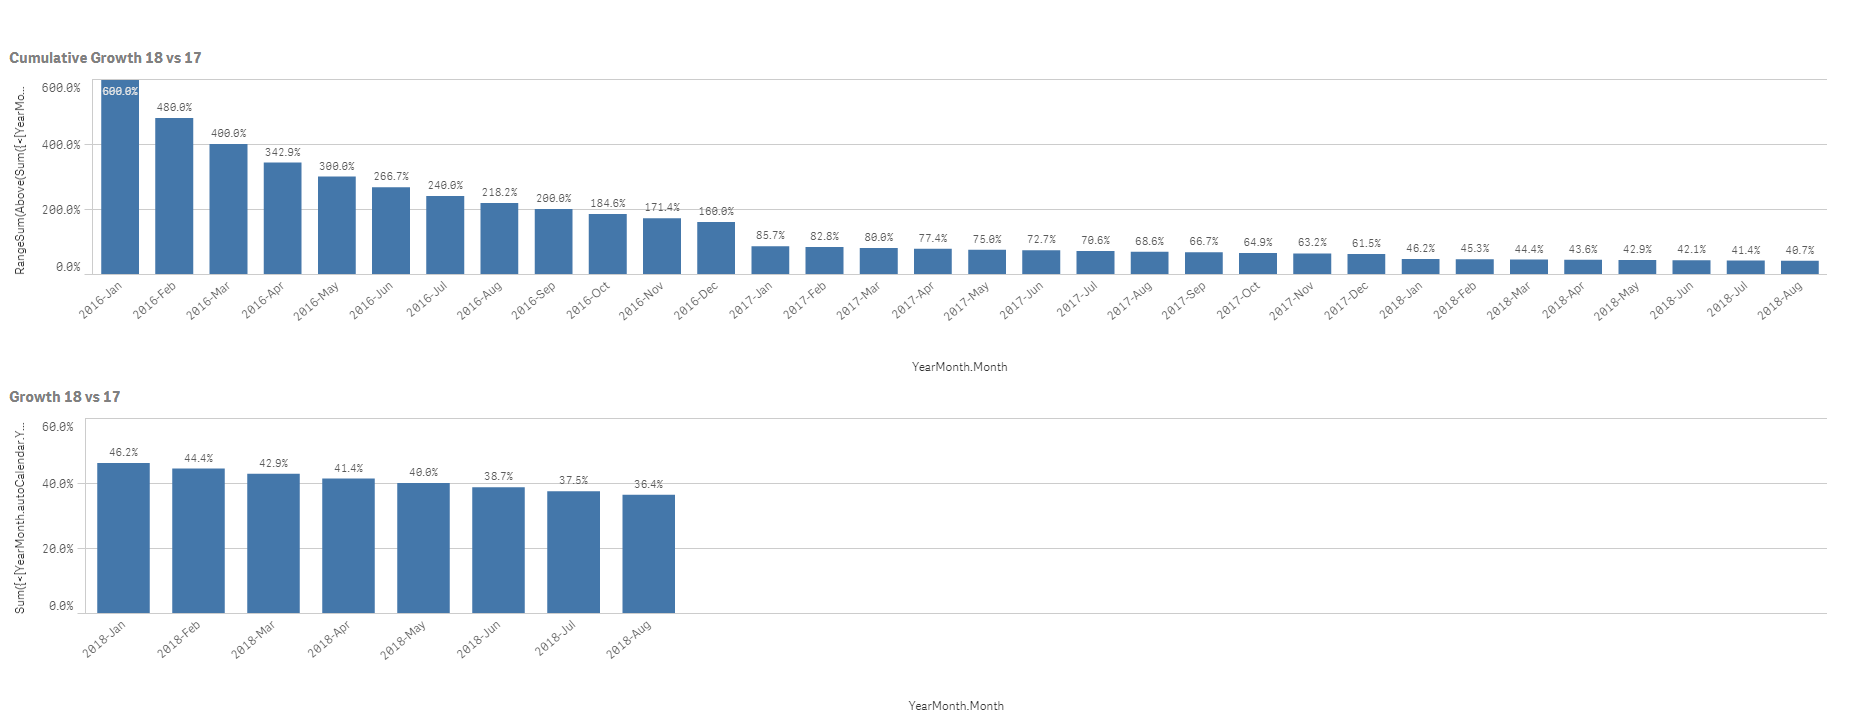
Try these
Cumulative
RangeSum(Above(Sum({<[YearMonth.autoCalendar.Year]>}Volume), 0, Only({1}[YearMonth.autoCalendar.Month])))/
Above(RangeSum(Above(Sum({<[YearMonth.autoCalendar.Year]>}Volume), 0, Only({1}[YearMonth.autoCalendar.Month]))), 12) - 1
Non cumulative
Sum({<[YearMonth.autoCalendar.Year] = {"$(=Year(Max([YearMonth.autoCalendar.Year])))"}>}Volume)/
Above(Sum({<[YearMonth.autoCalendar.Year] = {"$(=Year(Max([YearMonth.autoCalendar.Year]))-1)"}>}Volume), 12) - 1
- Mark as New
- Bookmark
- Subscribe
- Mute
- Subscribe to RSS Feed
- Permalink
- Report Inappropriate Content
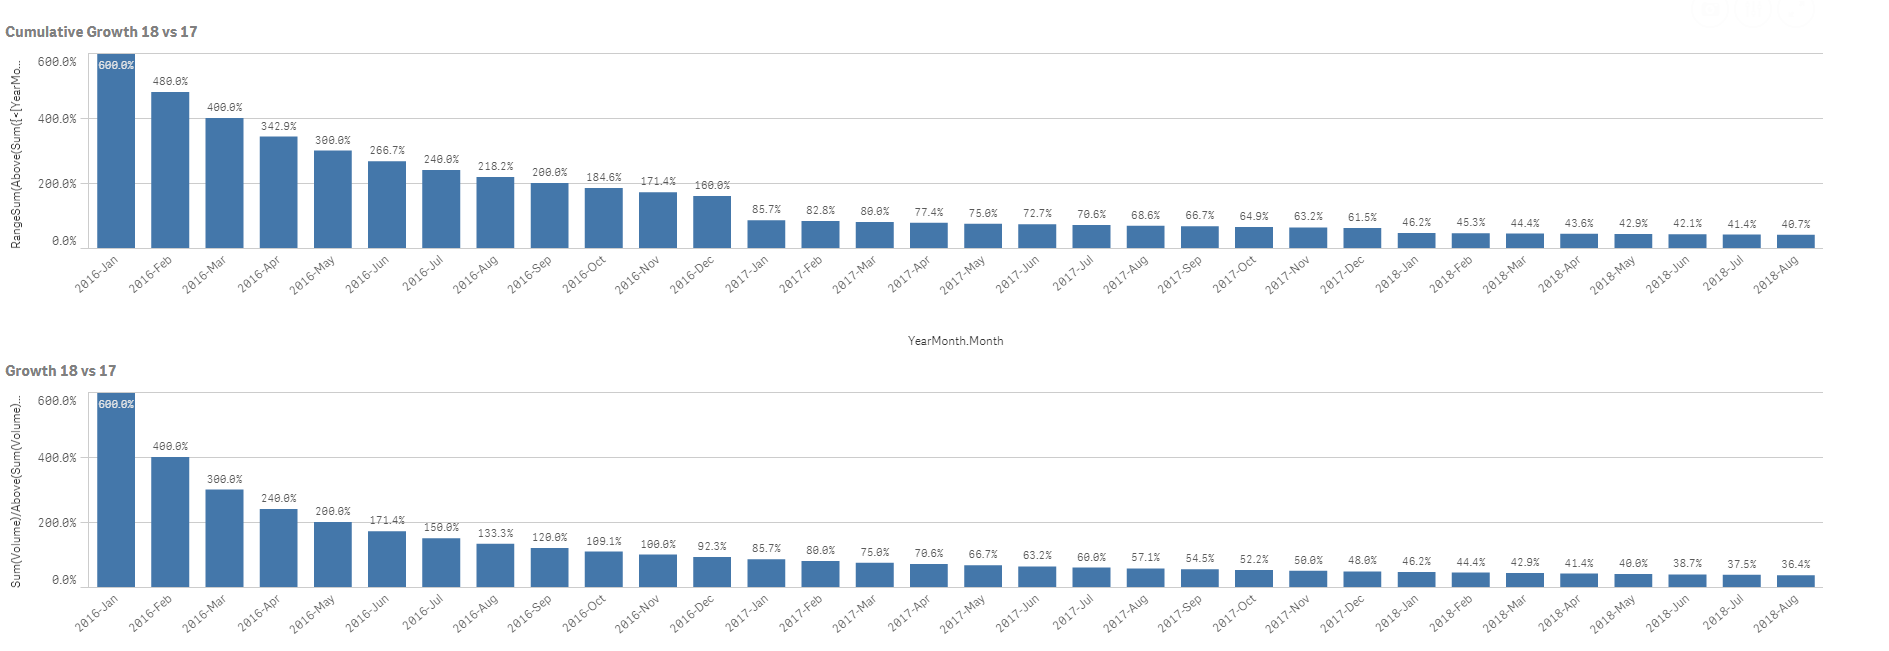
My bad, for non cumulative... try this
Sum(Volume)/Above(Sum(Volume), 12) - 1
- Mark as New
- Bookmark
- Subscribe
- Mute
- Subscribe to RSS Feed
- Permalink
- Report Inappropriate Content
Thanks a lot Sunny!
Best Regards,
Rony
- Mark as New
- Bookmark
- Subscribe
- Mute
- Subscribe to RSS Feed
- Permalink
- Report Inappropriate Content
No problem at all. Glad I was able to help.
Best,
Sunny
- « Previous Replies
- Next Replies »