Unlock a world of possibilities! Login now and discover the exclusive benefits awaiting you.
- Qlik Community
- :
- Forums
- :
- Analytics
- :
- New to Qlik Analytics
- :
- Current YTD vs Previous whole year showing togethe...
- Subscribe to RSS Feed
- Mark Topic as New
- Mark Topic as Read
- Float this Topic for Current User
- Bookmark
- Subscribe
- Mute
- Printer Friendly Page
- Mark as New
- Bookmark
- Subscribe
- Mute
- Subscribe to RSS Feed
- Permalink
- Report Inappropriate Content
Current YTD vs Previous whole year showing together
Hi,
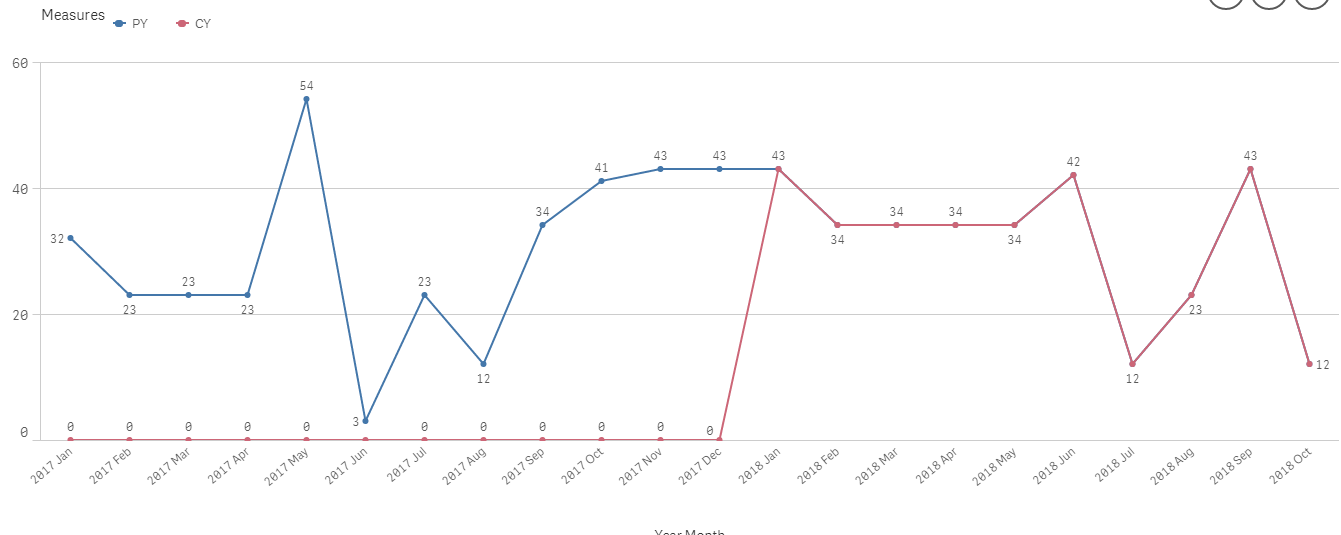
I have a line chart where I would like to display the current YTD and the previous full year.
The prev full year should be displayed with the current year values together e.g from JAN 2018 till DEC 2018 and not from JAN 2017 till DEC 2017.
With this, the prev vs curr can be compared easily.
I was able to solve it, with above function i shifted the previous year's value but when I do selection I lose prev year values.
Which make sense since Qlik Sense (  ) evaluate the prev year expression in the selected dims (2018) .
could you suggest solution which can be applied in frontend?
Thanks,
Daniel
- « Previous Replies
-
- 1
- 2
- Next Replies »
- Mark as New
- Bookmark
- Subscribe
- Mute
- Subscribe to RSS Feed
- Permalink
- Report Inappropriate Content
Hi Deniel,
What you are looking for is comparision as ref to previous year.
If you will create chart by using YEAR_Month Dim, it will return you 22 Point (from Jan 2017 to Oct -2018) on X-scale, this will never give you expected result (Comparision CY to PY)
Exp:
--->>
You can only use Month as Dimension Then only you can compare with previous year. For distinguish Measure, Use different color for measure and USE LEGEND.
Expression will be
PY -> Sum({<Year={">=$(=Max(Year-1))"}>}Sales)
CY -> Sum({<Year={">=$(=Max(Year))"}>}Sales)
Or anyother expression from above suggested by others, all will work accordingly.

I hope, It will work for you
- Mark as New
- Bookmark
- Subscribe
- Mute
- Subscribe to RSS Feed
- Permalink
- Report Inappropriate Content
Hi,
no it wont work.
I was able to do those.
However the requirement is again different.
I can achieve at backend, but I wanted to do it at fronted.
Dan
- Mark as New
- Bookmark
- Subscribe
- Mute
- Subscribe to RSS Feed
- Permalink
- Report Inappropriate Content
Can you explain in detail, what exactly you are doing in Backend? Any Code or Logic?. Please share.
So that, I can figure it out.
Thanks,
Amit
- Mark as New
- Bookmark
- Subscribe
- Mute
- Subscribe to RSS Feed
- Permalink
- Report Inappropriate Content
This is a POC (proof of concept) solution for this problem, which was written quickly but solve the issue. The key thing is the CalendarMixing (suggested by one of my colleague) table.
MainData:
Load
date(today() - IterNo()) as Date,
round(rand()*100) as Value
AutoGenerate 1
While 10000 - IterNo() > 0;
MinMax:
Load
min(Date) as minDate,
max(Date) as maxDate
resident MainData;
MinMaxWeek:
Load
WeekStart(Date) as WeekStart
resident MainData;
let vminDate = Peek('minDate',0,'MinMax');
let vmaxDate = Peek('maxDate',0,'MinMax');
drop table MinMax;
CalendarFlag:
Load
tempDate,
//FLAGS
If(tempDate>=AddMonths(today(),-2,1) and tempDate<=today(),1,0) as CURRENT_3_MONTH,
If(tempDate>=AddMonths(today(),-5,1) and tempDate<=AddMonths(today(),-3,1),1,0) as LAST_3_MONTH,
InYear(tempDate, today(),0) *-1 as CURRENT_YEAR,
InYear(tempDate, today(),-1) *-1 as LAST_YEAR,
if(tempDate>if(InWeek(tempDate,$(vmaxDate),-3),tempDate),tempDate,null()) as WeekFlag
// If(tempDate>=(if(InWeek(tempDate,$(vmaxDate),-3),tempDate)) and
// tempDate<=(if(InWeek(tempDate,$(vmaxDate),0),tempDate)),tempDate)
// as WeekFlag
;
Load
$(vminDate) + IterNo() as tempDate
AutoGenerate 1
while $(vminDate) + IterNo() <= $(vmaxDate);
CalendarMixing:
NoConcatenate
Load
tempDate as Date,
if(CURRENT_YEAR = 1
,date(tempDate)
,date(AddYears(tempDate,1))) as MixDate,
if(CURRENT_YEAR=1,1,2) as CURRENT_LAST_FLAG
Resident CalendarFlag
where LAST_YEAR + CURRENT_YEAR =1;
drop table MinMaxWeek;
With filter applied it is working:

Without filter: 
- « Previous Replies
-
- 1
- 2
- Next Replies »