Unlock a world of possibilities! Login now and discover the exclusive benefits awaiting you.
- Qlik Community
- :
- Forums
- :
- Analytics
- :
- New to Qlik Analytics
- :
- Customize the colors in Bar Chart
Options
- Subscribe to RSS Feed
- Mark Topic as New
- Mark Topic as Read
- Float this Topic for Current User
- Bookmark
- Subscribe
- Mute
- Printer Friendly Page
Turn on suggestions
Auto-suggest helps you quickly narrow down your search results by suggesting possible matches as you type.
Showing results for
Creator
2016-01-06
11:38 PM
- Mark as New
- Bookmark
- Subscribe
- Mute
- Subscribe to RSS Feed
- Permalink
- Report Inappropriate Content
Customize the colors in Bar Chart
Hi Friends,
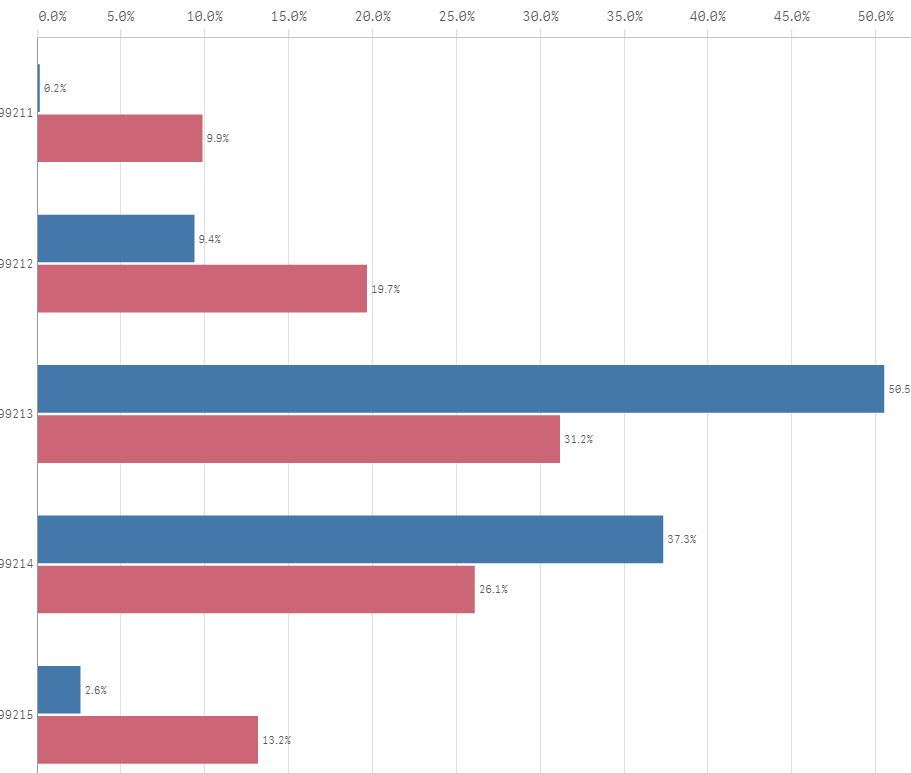
I have created one bar chart with one Dimension , two measures.
The chart looks like , i need to change the colors. can anyone help me on this. Thanks in Advance
593 Views
1 Solution
Accepted Solutions
Anonymous
Not applicable
2016-01-07
12:27 AM
- Mark as New
- Bookmark
- Subscribe
- Mute
- Subscribe to RSS Feed
- Permalink
- Report Inappropriate Content
467 Views
3 Replies
Anonymous
Not applicable
2016-01-07
12:27 AM
- Mark as New
- Bookmark
- Subscribe
- Mute
- Subscribe to RSS Feed
- Permalink
- Report Inappropriate Content
Did you check this?
Qlik Sense: How to set custom colors by measure in a bar chart
468 Views
Specialist II
2016-01-07
01:44 AM
- Mark as New
- Bookmark
- Subscribe
- Mute
- Subscribe to RSS Feed
- Permalink
- Report Inappropriate Content
Hi Balraj,
ValueList will fix ur dimension and make it static which is the big con of it.
467 Views
Anonymous
Not applicable
2016-01-07
01:53 AM
- Mark as New
- Bookmark
- Subscribe
- Mute
- Subscribe to RSS Feed
- Permalink
- Report Inappropriate Content
Okay,
Then what is the alternate of it?
467 Views
Related Topics
Community Browser