Unlock a world of possibilities! Login now and discover the exclusive benefits awaiting you.
- Qlik Community
- :
- Forums
- :
- Analytics
- :
- New to Qlik Analytics
- :
- Dimension on a chart based on IDs but showing name...
- Subscribe to RSS Feed
- Mark Topic as New
- Mark Topic as Read
- Float this Topic for Current User
- Bookmark
- Subscribe
- Mute
- Printer Friendly Page
- Mark as New
- Bookmark
- Subscribe
- Mute
- Subscribe to RSS Feed
- Permalink
- Report Inappropriate Content
Dimension on a chart based on IDs but showing names
Hi all,
I have a list of items to display as x-axis on a chart. In my table I have a field for the id and a field for the name of the item (item.id, item.name).
The ids are unique, but the names are not. So I can have:
(item.id, item.name) = (1001, 'Name A')
(item.id, item.name) = (1002, 'Name A')
(item.id, item.name) = (1003, 'Name A')
(item.id, item.name) = (1004, 'Name B')
(item.id, item.name) = (1005, 'Name C')
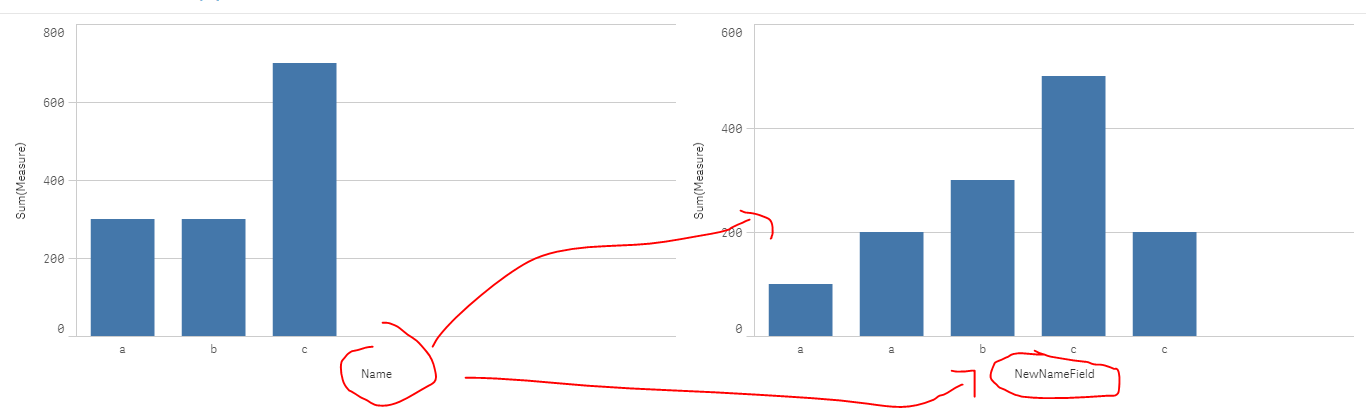
On the x-axis I want to show the names of the items. But if I put "item.name" as dimension, in the example I only get three points, because Qlik groups 1001, 1002, 1003 for having the same name.
How can I make that Qlik uses the ids but displays the names to the user?
I'm attaching a sketch of what Qlik is doing and what I'm trying to get.
Thanks!
- Tags:
- dimension
- line chart
Accepted Solutions
- Mark as New
- Bookmark
- Subscribe
- Mute
- Subscribe to RSS Feed
- Permalink
- Report Inappropriate Content
Here's an example on how u should treat such cases:
load Name,Dual(Name,Id) as NewNameField, Id, Measure Inline [
Name, Id, Measure
a,1 ,100
a,2,200
b,3,300
c,4,500
c,5,200
];
Now create a bar chart :
as dimension: NewNameField
as Measure: sum(Measure)
result:
- Mark as New
- Bookmark
- Subscribe
- Mute
- Subscribe to RSS Feed
- Permalink
- Report Inappropriate Content
While loading use Dual(item.name,item.id) as item.name. This will make the field display Name but use ID in calculation etc.
- Mark as New
- Bookmark
- Subscribe
- Mute
- Subscribe to RSS Feed
- Permalink
- Report Inappropriate Content
Here's an example on how u should treat such cases:
load Name,Dual(Name,Id) as NewNameField, Id, Measure Inline [
Name, Id, Measure
a,1 ,100
a,2,200
b,3,300
c,4,500
c,5,200
];
Now create a bar chart :
as dimension: NewNameField
as Measure: sum(Measure)
result:
- Mark as New
- Bookmark
- Subscribe
- Mute
- Subscribe to RSS Feed
- Permalink
- Report Inappropriate Content
Works great. Thank you guys!