Unlock a world of possibilities! Login now and discover the exclusive benefits awaiting you.
- Qlik Community
- :
- Forums
- :
- Analytics
- :
- New to Qlik Analytics
- :
- Display last 12 months data - qliksense
- Subscribe to RSS Feed
- Mark Topic as New
- Mark Topic as Read
- Float this Topic for Current User
- Bookmark
- Subscribe
- Mute
- Printer Friendly Page
- Mark as New
- Bookmark
- Subscribe
- Mute
- Subscribe to RSS Feed
- Permalink
- Report Inappropriate Content
Display last 12 months data - qliksense
Hello People
I want to display last 12 months sales data of different categories in a line chart. So i wrote the set analysis expression,
Sum( {$<month1={">=$(=MonthStart(AddMonths(Max(month1),-12)))"}*{"<$(=MonthEnd(Max(month1)))"}>} sales)
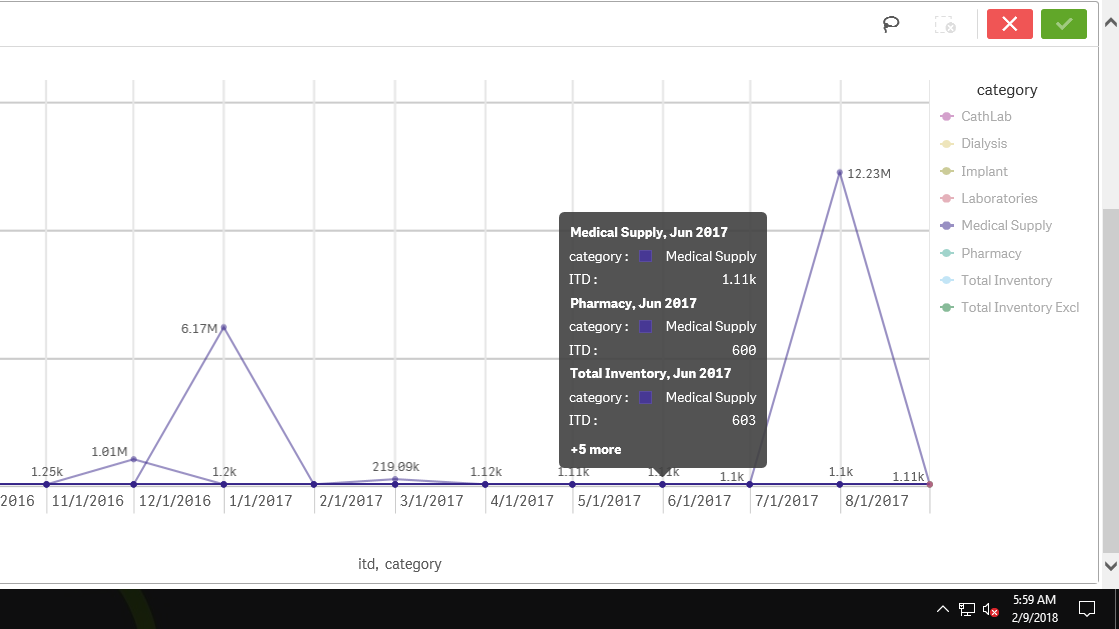
I get last 12 months data when i select month filter but the categories are not getting displayed.

Please help me solve this issue.
- Mark as New
- Bookmark
- Subscribe
- Mute
- Subscribe to RSS Feed
- Permalink
- Report Inappropriate Content
Please try this
SUM({$< MonthName=, Year={$(=max(Year)-1)},Quarter=
,[month1]={">=$(=MonthStart(max([month1),-12))<=$(=Monthend(addmonths(max([month1]),-12)))"}
>}[sales]
- Mark as New
- Bookmark
- Subscribe
- Mute
- Subscribe to RSS Feed
- Permalink
- Report Inappropriate Content
No. the code is not working. It gives me only selected month and selected - 12th month sales data. Even then categories are not getting displayed.
- Mark as New
- Bookmark
- Subscribe
- Mute
- Subscribe to RSS Feed
- Permalink
- Report Inappropriate Content
Please share some sample app.