Unlock a world of possibilities! Login now and discover the exclusive benefits awaiting you.
- Qlik Community
- :
- Forums
- :
- Analytics
- :
- New to Qlik Analytics
- :
- Displaying dimensions on chart as a group
- Subscribe to RSS Feed
- Mark Topic as New
- Mark Topic as Read
- Float this Topic for Current User
- Bookmark
- Subscribe
- Mute
- Printer Friendly Page
- Mark as New
- Bookmark
- Subscribe
- Mute
- Subscribe to RSS Feed
- Permalink
- Report Inappropriate Content
Displaying dimensions on chart as a group
I have a chart with the dimension(x-axis) as hours.
My chart has hours from 0 to 20 - which displays as a very compact chart..
How can I display it as <2 hours, <4 hours, 4-10 hours and >10 hours.
Thank you.
Accepted Solutions
- Mark as New
- Bookmark
- Subscribe
- Mute
- Subscribe to RSS Feed
- Permalink
- Report Inappropriate Content
in the load script,try to create a cluster dimension as:
load
if( hours<2, '<2 hours',
if( hours<4 and hours>2, '<4 hours',
if( hours<10 and hours>4, '<4-10 hours',
if( hours>10, '>10 hours')))) as clusterHours
- Mark as New
- Bookmark
- Subscribe
- Mute
- Subscribe to RSS Feed
- Permalink
- Report Inappropriate Content
Hi Cedric,
You can create those ranges in the load script so for example, given that your data model has a field named "Time"
If(Frac(Now()) * 24 > 10, '>10 Hours', If(Frac(Now()) * 24 > 4, '>4 Hours', If(Frac(Now()) * 24 > 2, '4-10 Hours', '<2 hours') AS TimeRange
Miguel
- Mark as New
- Bookmark
- Subscribe
- Mute
- Subscribe to RSS Feed
- Permalink
- Report Inappropriate Content
Hello Cedric - what Mario has stated is correct, but you could also put this as a reusable Dimension in the section marked library on the left, without having to use it in the script.
Check out the screens and this video: Using The Master Library (video)

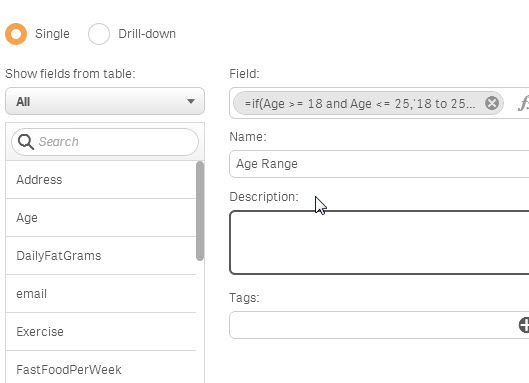
Under Dimensions click - Create New
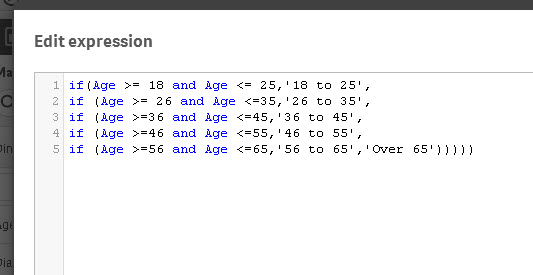
Name and add your expression
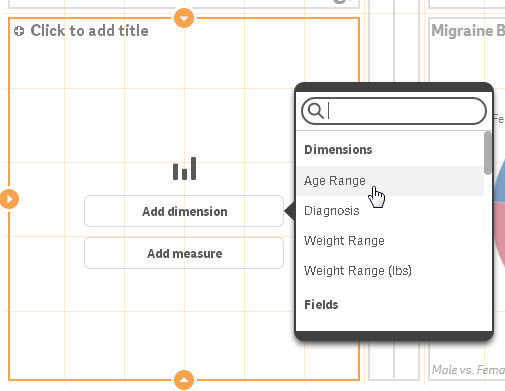
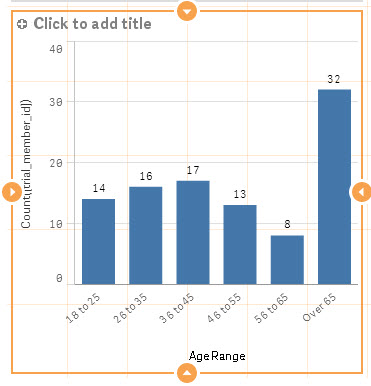
The you can use it in your chart object
Mike Tarallo
Qlik