Unlock a world of possibilities! Login now and discover the exclusive benefits awaiting you.
- Qlik Community
- :
- Forums
- :
- Analytics
- :
- New to Qlik Analytics
- :
- Re: Dynamic graph from first month of year to sele...
- Subscribe to RSS Feed
- Mark Topic as New
- Mark Topic as Read
- Float this Topic for Current User
- Bookmark
- Subscribe
- Mute
- Printer Friendly Page
- Mark as New
- Bookmark
- Subscribe
- Mute
- Subscribe to RSS Feed
- Permalink
- Report Inappropriate Content
Dynamic graph from first month of year to selected month via filter
Hi,
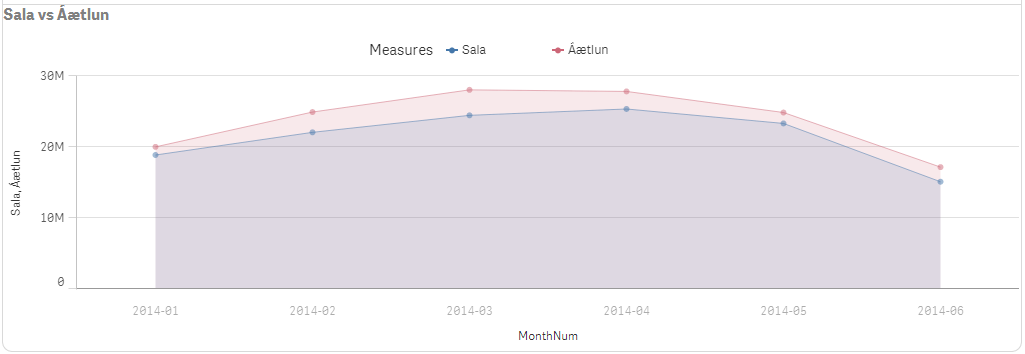
I have a small problem. I would like to create a chart like this one. But have the months added dynamically based on what monthnumber the users chooses. So if the user chooses month 4 the chart would display months from 1-4., or like the picture shows month 6 is choosen it display from 1-6. So I guess I need an expression for x-axis, but I cant get my head around. All hints would be greatly appreciated.
Regards
Birkir
Accepted Solutions
- Mark as New
- Bookmark
- Subscribe
- Mute
- Subscribe to RSS Feed
- Permalink
- Report Inappropriate Content
Hi Birkir,
Dimension: "MonthNum" or "MonthNumShort" (use only the field you want to display)
Measure: use set analysis to limit the period you want to display
e.g.
Dimension: MonthNumShort (1-12)
Measure : Sum(Sales)
-will sum all values according to MonthNum
Sum({$<MonthNumShort={">=1<=$(=Max(MonthNumShort))"}>}Sales)
-will show values from 1 to selected month number
Please check attached qvf.
Regards,
Ronny
- Mark as New
- Bookmark
- Subscribe
- Mute
- Subscribe to RSS Feed
- Permalink
- Report Inappropriate Content
You should be able to do this using set analysis. Add the following to your Expression:
{<MonthNum = {"$(='>='& Date(YearStart(Max(MonthNum)), 'YYYY-MM') & '<=' & Date(Max(MonthNum), 'YYYY-MM'))"}>}
User will then be able to make a selection in MonthNum list box to determine what he wants to see 2014-03 will display 2014-01, 2014-02 & 2014-03
HTH
Best,
Sunny
- Mark as New
- Bookmark
- Subscribe
- Mute
- Subscribe to RSS Feed
- Permalink
- Report Inappropriate Content
You can do this by using set analysis in your expressions.
Please have a look at this introduction:
The Magic of Set Analysis - Point In Time Reporting • Blog • AfterSync
Basically, you are using something like
=Sum({<Date = {">$(=Yearstart(max(Date)))<=$(=max(Date))"}, Month=, Year= >} Sales)
assuming a calendar with Date, Month, Year.
- Mark as New
- Bookmark
- Subscribe
- Mute
- Subscribe to RSS Feed
- Permalink
- Report Inappropriate Content
Hi I have tried what you suggested but I get a invalid dimension . Here below is a set analysis I use in KPI box, sums up to sales to selected month.
=Sum({$<MonthNumShort={">=$(=1)<=$(=max(MonthNumShort))"}>}Sales)
So could I use this for the dimension members?
{$<MonthNumShort={">=$(=1)<=$(=max(MonthNumShort))"}>}
MonthNumShort is the monthnumber or 1,2,3,4,5,6,7,8,9,10,11,12
- Mark as New
- Bookmark
- Subscribe
- Mute
- Subscribe to RSS Feed
- Permalink
- Report Inappropriate Content
Hi Birkir,
Dimension: "MonthNum" or "MonthNumShort" (use only the field you want to display)
Measure: use set analysis to limit the period you want to display
e.g.
Dimension: MonthNumShort (1-12)
Measure : Sum(Sales)
-will sum all values according to MonthNum
Sum({$<MonthNumShort={">=1<=$(=Max(MonthNumShort))"}>}Sales)
-will show values from 1 to selected month number
Please check attached qvf.
Regards,
Ronny
- Mark as New
- Bookmark
- Subscribe
- Mute
- Subscribe to RSS Feed
- Permalink
- Report Inappropriate Content
Hi,
If you attach sample file then it would be easier to provide solution.
If You have a date field then you can use like below
Sum({<MonthNum=, DateFieldName={{<'>=$(=YearStart(Max(DateFieldName)))<=$(=Date(Max(DateFieldName)))'>}}>} Sales)
Replace MonthNum, DateFieldName, Sales with your actual field names.
Regards,
Jagan.
- Mark as New
- Bookmark
- Subscribe
- Mute
- Subscribe to RSS Feed
- Permalink
- Report Inappropriate Content
Hi Ronny
Thank you for this. This solved this for me. I was trying to solve this my filtering the dimension members on the dimension not by using the measure.
Thank you for your help.
- Mark as New
- Bookmark
- Subscribe
- Mute
- Subscribe to RSS Feed
- Permalink
- Report Inappropriate Content
Hi All,
Thank you so much for all of your input, it is an honor to be part of such a community. Ronny came up with a demo that explained this to me and I now get my mistake. I was always trying to filter the dimsion members via Set analysis but not use the measure to filter the members.
Thanks again for all of your support.
Kind regards
Birkir
- Mark as New
- Bookmark
- Subscribe
- Mute
- Subscribe to RSS Feed
- Permalink
- Report Inappropriate Content
Dear Birkin,
Good to hear that this help you to solve the problem.
Can you please mark the answer as correct and not the reply to the answer.
Regards,
Ronny
- Mark as New
- Bookmark
- Subscribe
- Mute
- Subscribe to RSS Feed
- Permalink
- Report Inappropriate Content
Hi,
I have marked your answear as the correct one 
Thanks again