Unlock a world of possibilities! Login now and discover the exclusive benefits awaiting you.
- Qlik Community
- :
- Forums
- :
- Analytics
- :
- New to Qlik Analytics
- :
- Embedding Qliksense graph to my Application
- Subscribe to RSS Feed
- Mark Topic as New
- Mark Topic as Read
- Float this Topic for Current User
- Bookmark
- Subscribe
- Mute
- Printer Friendly Page
- Mark as New
- Bookmark
- Subscribe
- Mute
- Subscribe to RSS Feed
- Permalink
- Report Inappropriate Content
Embedding Qliksense graph to my Application
Hello All
I need some suggestion based on embedding qliksense generated charts to web-application but it should be dynamic, i checked on single configurator but it only generates static charts, it'll not update the values.
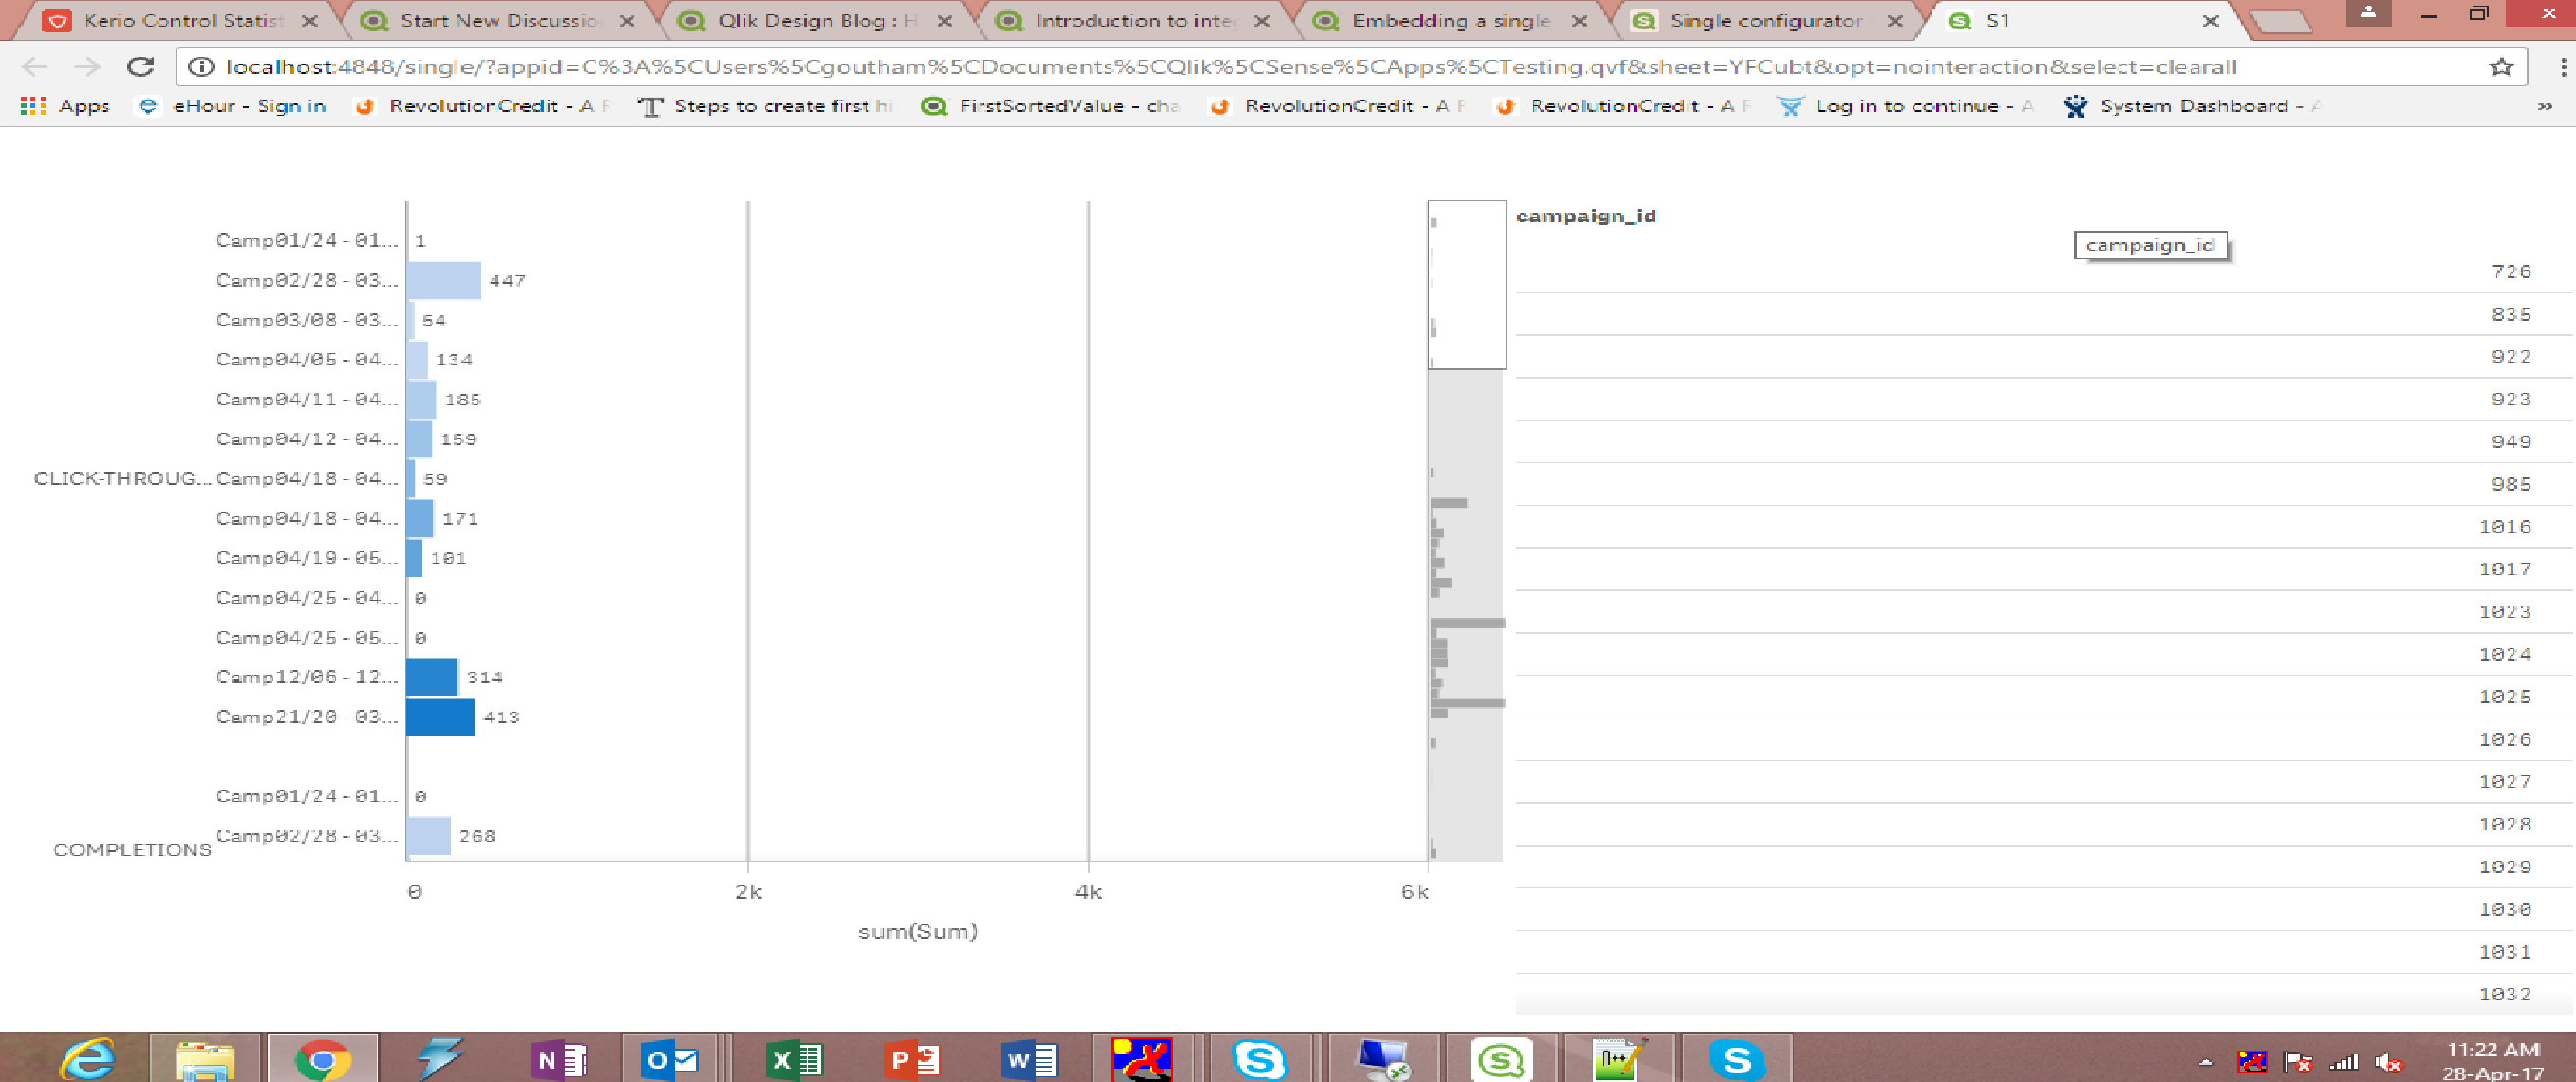
I have this sample chart:

My goal is to create the link in my web-application and by clicking it i should have line/bar chart with filterpane, if i change campaign_id
the values should automatically change in chart.
- « Previous Replies
-
- 1
- 2
- Next Replies »
- Mark as New
- Bookmark
- Subscribe
- Mute
- Subscribe to RSS Feed
- Permalink
- Report Inappropriate Content
And i just need to know, if i attached hyperlink to my application to view camp counts(as mentioned in above figure) does it update the values or i need manually to update links everytime through single configurator.
- Mark as New
- Bookmark
- Subscribe
- Mute
- Subscribe to RSS Feed
- Permalink
- Report Inappropriate Content
Ok bro,,
so just need one more information,,,where can i get tutorials or videos to this,,,
can u share it,,,,
Best regards
- Mark as New
- Bookmark
- Subscribe
- Mute
- Subscribe to RSS Feed
- Permalink
- Report Inappropriate Content
And also workbench is not available for qliksense server for creating mashups i think so,,which approach i need to go for both server and localhost,
But i have devhub is it possible to create mashups in that
- Mark as New
- Bookmark
- Subscribe
- Mute
- Subscribe to RSS Feed
- Permalink
- Report Inappropriate Content
- Mark as New
- Bookmark
- Subscribe
- Mute
- Subscribe to RSS Feed
- Permalink
- Report Inappropriate Content
Mashups are ALWAYS created within the Dev-Hub in a Qlik Sense Server or Desktop
- Mark as New
- Bookmark
- Subscribe
- Mute
- Subscribe to RSS Feed
- Permalink
- Report Inappropriate Content
I have done mashup, and that mashup name is there in extensions(qmc),,
What is my next step in embedding my application to the qliksense charts,,,i'm bit confused by referring qliksense documentation.
- « Previous Replies
-
- 1
- 2
- Next Replies »