Unlock a world of possibilities! Login now and discover the exclusive benefits awaiting you.
- Qlik Community
- :
- Forums
- :
- Analytics
- :
- New to Qlik Analytics
- :
- Expression for Growth Rates
- Subscribe to RSS Feed
- Mark Topic as New
- Mark Topic as Read
- Float this Topic for Current User
- Bookmark
- Subscribe
- Mute
- Printer Friendly Page
- Mark as New
- Bookmark
- Subscribe
- Mute
- Subscribe to RSS Feed
- Permalink
- Report Inappropriate Content
Expression for Growth Rates
Hello Everyone,
I am trying to add growth rates with respect to the Avg. Selling Price (ASP=Value/Volume) of our product, for the years 2015-2018. When I select years 2015 & 2016, I need to be able to see 2016 ASP growth over 2015 ASP and so on. The data has been entered in ascending order. I tried to apply the formula, Sum(Value/Volume)/Above(Sum(Value/Volume)) - 1, but it does not seem to be working. Is there something that I am doing wrong? Please advice.
Regards,
Rony
- Mark as New
- Bookmark
- Subscribe
- Mute
- Subscribe to RSS Feed
- Permalink
- Report Inappropriate Content
I tried to apply the formula, Sum(Value/Volume)/Above(Sum(Value/Volume)) - 1, but it does not seem to be working.
Why do you think that this isn't working? Would you be able to share more information on what you got and what you expect to see?
- Mark as New
- Bookmark
- Subscribe
- Mute
- Subscribe to RSS Feed
- Permalink
- Report Inappropriate Content
Hi,
if you have many lines of same product for a year you can't say : sum(value/volume) for the average,
but prefer : sum(value) / sum(volume)
(average of total is not sum of average !)
- Mark as New
- Bookmark
- Subscribe
- Mute
- Subscribe to RSS Feed
- Permalink
- Report Inappropriate Content
Hi Oliver,
I tried this too but it does not seem to be working.
Rony
- Mark as New
- Bookmark
- Subscribe
- Mute
- Subscribe to RSS Feed
- Permalink
- Report Inappropriate Content
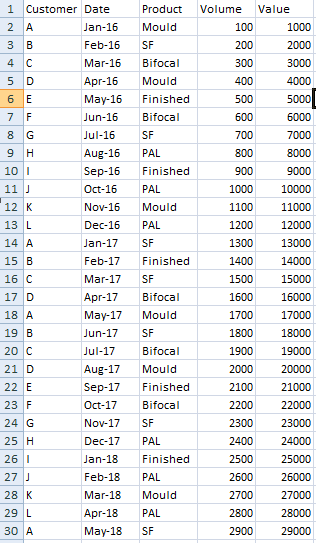
Hi Sunny,
I am attaching an image with sample excel data that I am using as I am not getting the advanced editor option to attach a qvf. I want to be able to see the ASP growth rates for the years that I select. Also, if I am using a chart to represent the growth rates what would the dimension be? Or should the growth rates be displayed as a KPI. Please let me know how you think this can be achieved.
Regards,
Rony
- Mark as New
- Bookmark
- Subscribe
- Mute
- Subscribe to RSS Feed
- Permalink
- Report Inappropriate Content
Look here on how to Uploading a Sample
- Mark as New
- Bookmark
- Subscribe
- Mute
- Subscribe to RSS Feed
- Permalink
- Report Inappropriate Content
Hello Ron,
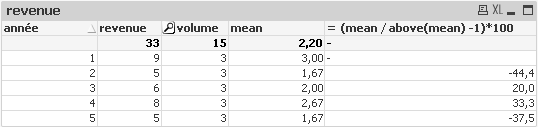
you must have only year in dimension,
in order to above() is correct
where mean = sum(revenue) / sum(volume)