Unlock a world of possibilities! Login now and discover the exclusive benefits awaiting you.
- Qlik Community
- :
- Forums
- :
- Analytics
- :
- New to Qlik Analytics
- :
- Firsts steps... donut chart
- Subscribe to RSS Feed
- Mark Topic as New
- Mark Topic as Read
- Float this Topic for Current User
- Bookmark
- Subscribe
- Mute
- Printer Friendly Page
- Mark as New
- Bookmark
- Subscribe
- Mute
- Subscribe to RSS Feed
- Permalink
- Report Inappropriate Content
Firsts steps... donut chart
Hi,
I'm a new user of Qlik Sense  . I followed the developer tutorial and tried to use come data of mine, but I need some help.
my data has the following format :
| Nb Player | Game 1 | Game 2 | Game 3 | etc. |
|---|---|---|---|---|
| 1 | 1 | |||
| 2 | 1 | |||
| 3 | 1 | 1 | ||
| 4 | 1 | 1 | ||
| 5 | 1 | 1 | ||
| 6 | 1 | 1 | ||
| 7 | 1 | |||
| etc. | 1 |
I have players, games, and "1" means that the player won the corresponding game.
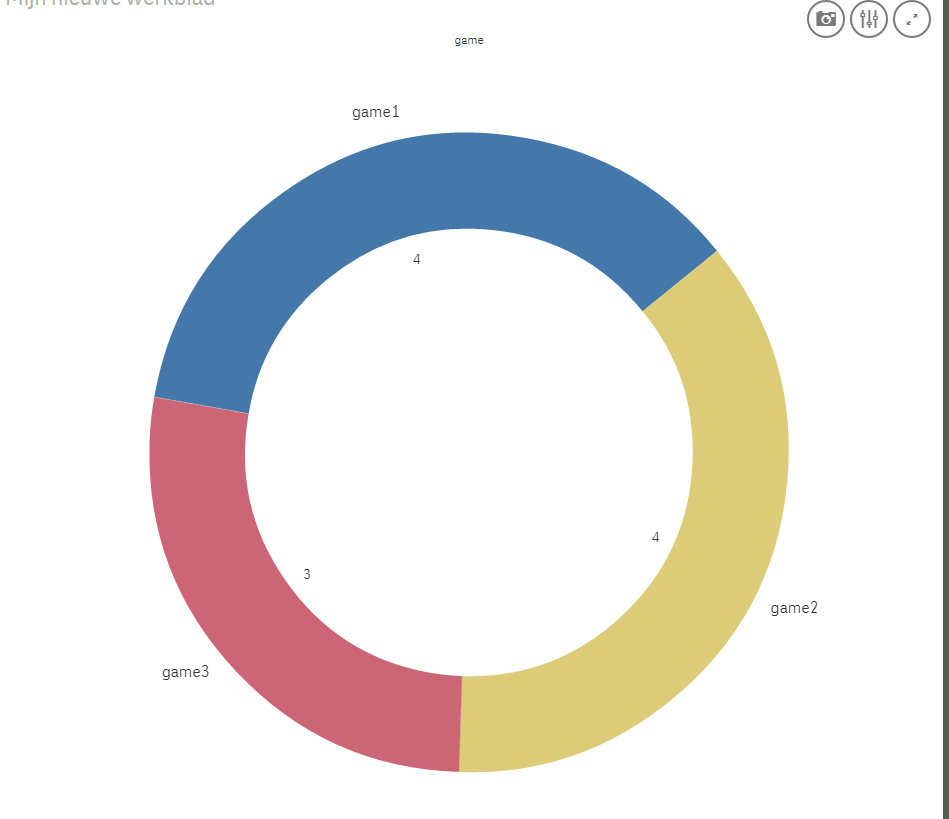
What I'm trying to do is making a donut chart in which the dimensions are the games ("Game 1", "Game 2", etc.) and the measures are the number of points earned by all players (4 for "Game 1", 5 for "Game 2", etc.).
1) I know how to do this for one game ("Game 1" as dimension, count("Game 1") as a measure), but I didn't found out how to put all games as dimensions and all their totals as measure in the same chart.
2) More difficult : after doing that, I would like to go deeper in the analysis. When I have the donut chart, and I click on "Game 2" for example, I want Qlik Sense to tell me among the players who won "Game 2", how many also won "Game 1" and "Game 3" (a sunburst can be a good idea ?)
Hope you can help me
Thanks !
Souss
- Mark as New
- Bookmark
- Subscribe
- Mute
- Subscribe to RSS Feed
- Permalink
- Report Inappropriate Content
Hello qliksouss,
Is this the result you want to achieve?
1: You have the amount of won games per game:
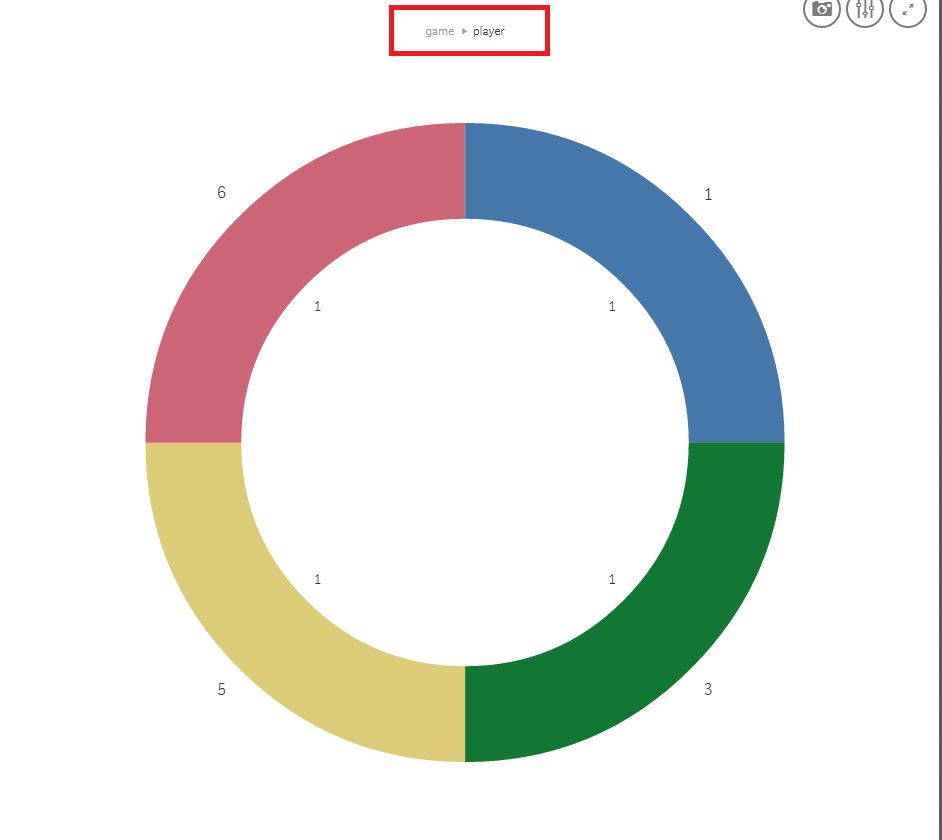
--> When you click on a game you get the amount of times a player won that game:
If this is the outcome you want, I can help you in achieving this.
Greetings,
Van Even Stijn
- Mark as New
- Bookmark
- Subscribe
- Mute
- Subscribe to RSS Feed
- Permalink
- Report Inappropriate Content
Hi Stijn VanEven, thank you for your quick answer !
For the step 1), yes that is what I want to achieve
For the step 2), "the amount of times a player won that game" will always be 1 so it does not fit exactly my need. BUT it gave me another idea. In your example, is it possible to select "Game 1" and "Game 2" and see which players have won both of them ?
The perfect thing would be what I asked first 
Thanks !
- Mark as New
- Bookmark
- Subscribe
- Mute
- Subscribe to RSS Feed
- Permalink
- Report Inappropriate Content
Any help ?
- Mark as New
- Bookmark
- Subscribe
- Mute
- Subscribe to RSS Feed
- Permalink
- Report Inappropriate Content
Up