Unlock a world of possibilities! Login now and discover the exclusive benefits awaiting you.
- Qlik Community
- :
- Forums
- :
- Analytics
- :
- New to Qlik Analytics
- :
- Flag for Pie chart
- Subscribe to RSS Feed
- Mark Topic as New
- Mark Topic as Read
- Float this Topic for Current User
- Bookmark
- Subscribe
- Mute
- Printer Friendly Page
- Mark as New
- Bookmark
- Subscribe
- Mute
- Subscribe to RSS Feed
- Permalink
- Report Inappropriate Content
Flag for Pie chart
Hi all,
I want to create a pie chart with the bucket values like below
0-7 days
7-14 days
14-30 days
30-60 days
so I want this from "updated date column"
I don't have master calendar . And I need result in days.
- « Previous Replies
-
- 1
- 2
- Next Replies »
- Mark as New
- Bookmark
- Subscribe
- Mute
- Subscribe to RSS Feed
- Permalink
- Report Inappropriate Content
Hi Sony,
Please find the test qvw.
- Mark as New
- Bookmark
- Subscribe
- Mute
- Subscribe to RSS Feed
- Permalink
- Report Inappropriate Content
Hi Sony, download this qvw file and try the steps it will automatic convert it into qvf
A QVW to QVF Conversion That Makes Sense | Analytics8
https://help.qlik.com/en-US/sense/2.2/Subsystems/Hub/Content/LoadData/create-app-from-document.htm
- Mark as New
- Bookmark
- Subscribe
- Mute
- Subscribe to RSS Feed
- Permalink
- Report Inappropriate Content
I need only specified range only. if I use above its givng more range
- Mark as New
- Bookmark
- Subscribe
- Mute
- Subscribe to RSS Feed
- Permalink
- Report Inappropriate Content
Hi Sony,
I have mentioned below the qlikview script.
LOAD ID,
Category,
[Open Date],
[Close Time],
Assgn,
[Update Time],
Breach,
Interval([Update Time]-[Open Date],'d')as Interval_date
FROM
(ooxml, embedded labels, table is Sheet1);
In dimension use for specific range as per your requirement:
=if(Interval_date<7,'0-7 days', if(Interval_date >7 and Interval_date < 14,'7-14 days', if(Interval_date >14 and Interval_date < 30,'14-30 days',if(Interval_date <60 and Interval_date >30,'30-60 days' ))))
In Expression use: count(Interval_date)
- Mark as New
- Bookmark
- Subscribe
- Mute
- Subscribe to RSS Feed
- Permalink
- Report Inappropriate Content
thanks Abhi,
I will check and update you
- Mark as New
- Bookmark
- Subscribe
- Mute
- Subscribe to RSS Feed
- Permalink
- Report Inappropriate Content
Hi,
you can try like this,
Fact:
load *, if( (age) = 0, '0',
if( (age) >=0 and (age) <7 , '0-7 days',
if( (age) >=7 and (age) <14, '7-14 days',
if( (age) >=14 and (age) <30, '14-30 days',
if( (age) >=30 and (age) <60, '30-60 days'))))) as aging_bucket;
LOAD ID,
Category,
[Open Date],
[Close Time],
Assgn,
[Update Time],
Breach,
Interval([Update Time]-[Open Date],'dd') as age
FROM
(ooxml, embedded labels, table is Sheet1);
- Mark as New
- Bookmark
- Subscribe
- Mute
- Subscribe to RSS Feed
- Permalink
- Report Inappropriate Content
thanks devarasu,
I will try this also
- Mark as New
- Bookmark
- Subscribe
- Mute
- Subscribe to RSS Feed
- Permalink
- Report Inappropriate Content
Hi,
I want to show by status but it is givng me wrong
- Mark as New
- Bookmark
- Subscribe
- Mute
- Subscribe to RSS Feed
- Permalink
- Report Inappropriate Content
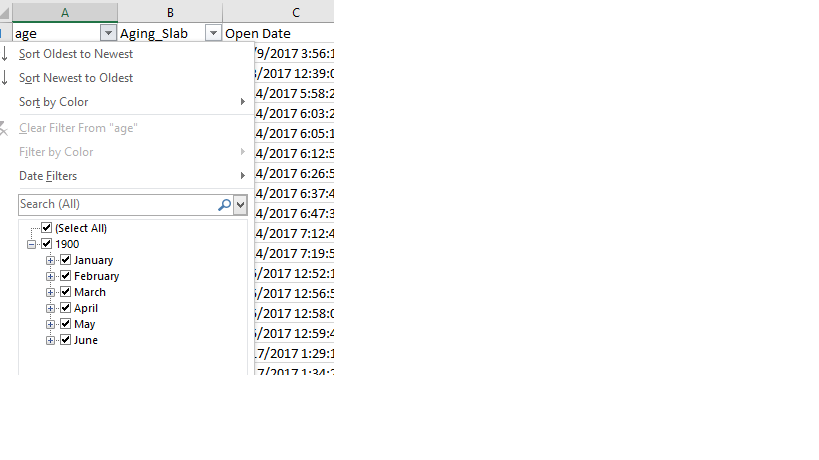
And Age column is also giving wrong result
it is taking the year 1900

- « Previous Replies
-
- 1
- 2
- Next Replies »